2. Working with Time Series
Mauna Loa atmospheric carbon dioxide time series (5/5)
Cyclic components cont.
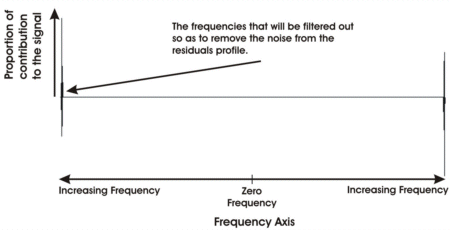
We will now use this frequency data to separate the noise from the other cyclic components.
Noise is defined as the random variations that occur from observation to observation in a dataset. This means that they must only occur in the very high frequency components of this frequency data.
The frequencies selected in the next graph will be removed from the frequency data by filtering them out, thereby removing the noise.
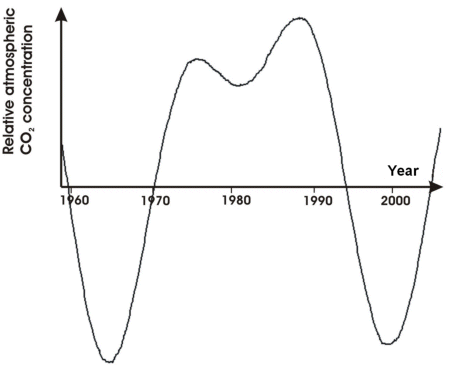
Once these frequencies have been removed, then the remaining frequency data is inverted by processing with the inverse Fourier Transform, so as to get data in the real (or time) domain.
Doing this gives the result shown below, which represents the non-annual cyclic components in the data.
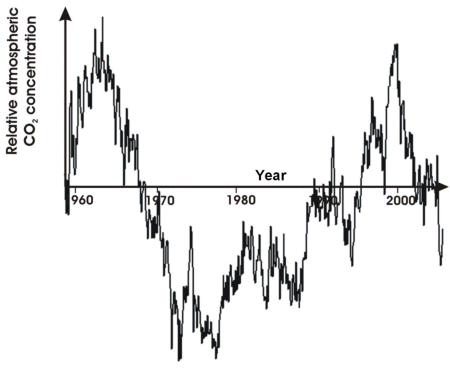
Now, we can subtract this signal from the signal that we started this page with, to get the noise component.

What do you think of this? Do you think that it still contains some cyclic components? It does seem to, even though it is very small. Maybe we should just have filtered out the highest frequency?
So, now you can see that a time series can consist of:
- a long term trend, which may or may not be cyclic itself if the time series is long enough
- an annual cycle that can actually change from year to year
- other cyclic components
- a random or noise component


