2. Working with Time Series
In this chapter we will use several case studies to see how we can analyse time series data. We will start with data measured in tidal flats of the southern North Sea, and then look at the Mauna Loa data on carbon dioxide in the atmosphere.
Measurements in the Wadden Sea (1/3)
Muddy coasts are a typical feature of the southern North Sea. Measurements of environmental parameters are most difficult because of the low water depth, which does not allow larger research vessels to operate in this area. Moreover, the most important changes of the shape of sandbanks and coastal inlets occur in bad weather conditions; however, an operation of a small coastal research vessel in the tidal flats at wind force eight and beyond is more than could be safely handled. A way to overcome this situation is to install permanent measuring stations which collect data automatically and continuously, and transmit them via telemetry to a receiving station on land. Since autumn 2002, such time series data have been collected at a station in the tidal inlet of the East-Frisian island Spiekeroog.
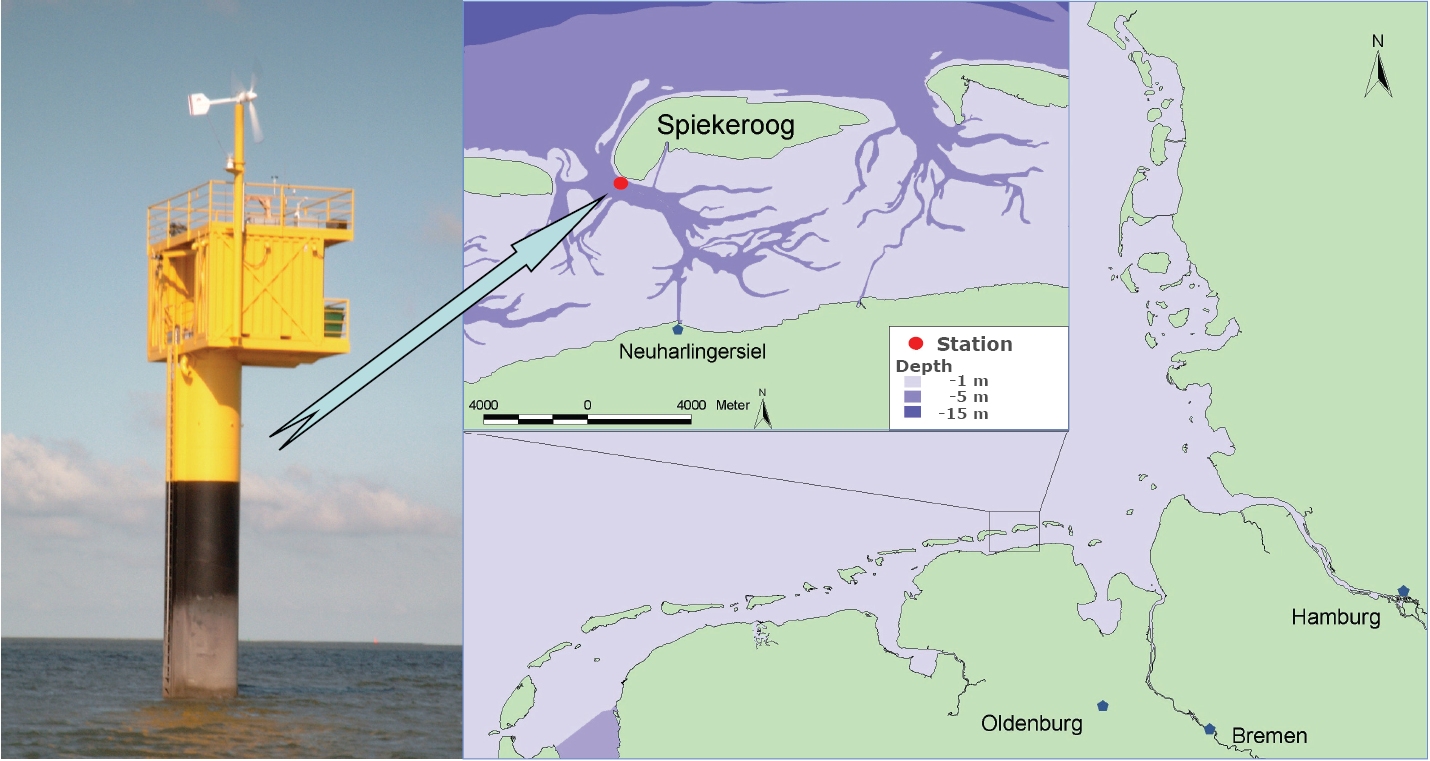
At this station, data such as air temperature, wind speed and direction, atmospheric pressure, seawater temperature and salinity, water level, algae content in the water, and other quantities are measured at 10-minute intervals. We will first have a closer look at the air and water temperature, and at the salinity of the seawater, to understand how their values depend on the actual weather.
The Wadden Sea is characterised by tides, and therefore one observes tidal variations of the water level which were already discussed on page 4 in chapter 1. Changes of the water level result from tidal currents: there is an accumulation of water at the coastline during high tide and a drawdown during low tide (see also chapter 5 of the SEOS tutorial on Ocean Currents).
Water temperature and salinity are subject to changes due to weather. This can be observed particularly in the backbarrier area where the water depth is very low as depicted on the map above. Therefore, seawater temperature and salinity data measured at the station - where the water passes by due to the tidal currents - often show fluctuations with the tidal period.
Data covering eight days time

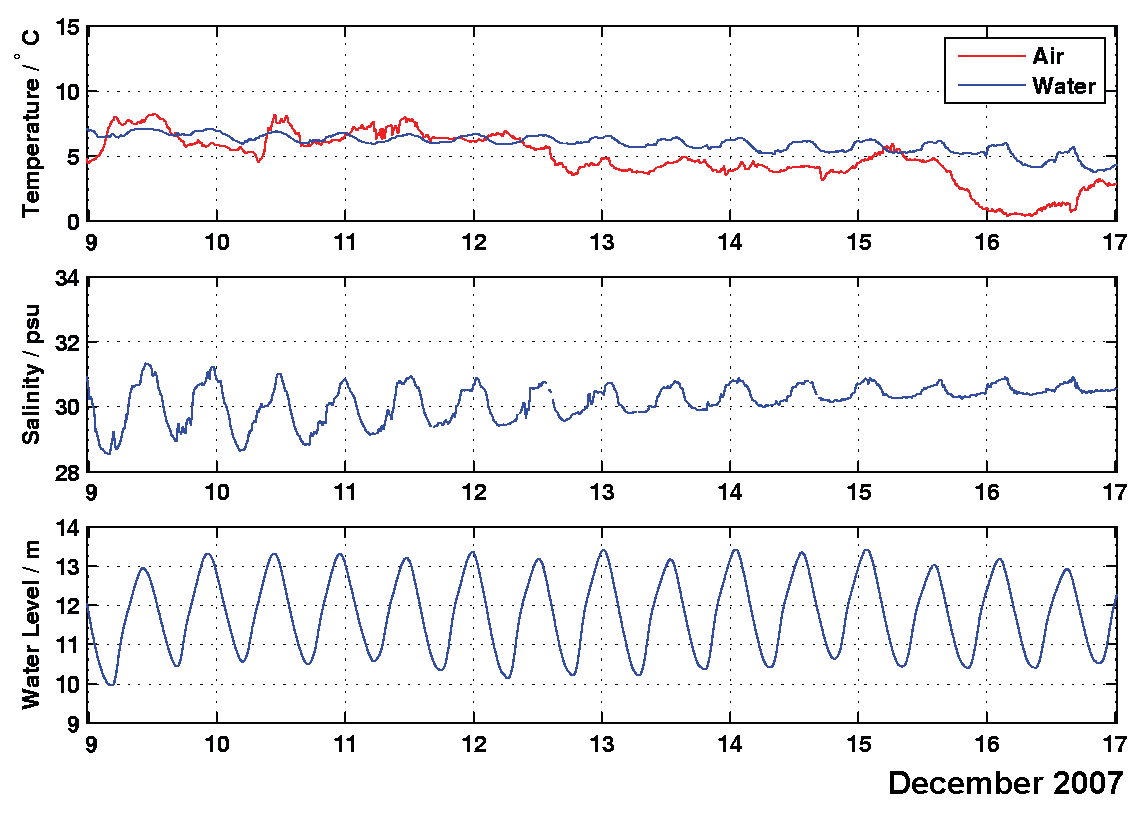
In the graphs above salinity is given in Practical Salinity Units (psu). This is because salinity cannot be directly measured but is calculated from data of temperature, hydrographic pressure and electrical conductivity of the seawater; practically speaking, psu values correspond to values of salt in grams per kilogram of seawater. Marks at the time axis correspond to 0h of the day.
