2. Working with Time Series
Linear regression analysis (3/3)
Step 4: Calculating the correlation coefficient
We consider a number of data points , with i=1, ..., n, their centroid , and a best-fit line calculated with linear regression analysis. It is often important to investigate the quality of the modelled best-fit line, i.e., in which quality the data points are represented by the fit line. The line would be an ideal model of the data points if the points were all lying exactly on the fit line. With real data this is not the case and the points exhibit more or less strong deviations.
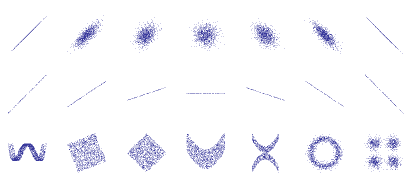
The correlation coefficient r is a measure to quantify the deviation of data points from their best-fit line. It takes on values between -1 and +1, whereby r=+1 or -1 corresponds to an ideal correlation (i.e., data points are exactly lying on the fit line) and r=0 to an absence of any correlation (data cannot be fitted by a line). The sign of r is the same as the sign of the slope a of the fit line: a>0 yields positive r, a<0 yields negative r.
The correlation coefficient is calculated with the following equation:
With the data in the table of seawater temperatures in July ...
| Year | xi | yi |
| 2003 | 1.58 | 19.69 |
| 2004 | 2.58 | 17.38 |
| 2005 | 3.58 | 18.98 |
| 2006 | 4.58 | 21.12 |
| 2007 | 5.58 | 18.23 |
| 2008 | 6.58 | 18.67 |
... one calculates: r=−0.017
This value is very close to zero. How can we interpret this result? The calculated slope a of the best-fit line also close to zero, the line is almost horizontal. Hence, as a result of the regression analysis there is virtually no trend of the data points to changing y (or: temperature) with increasing x (or: calendar years). Accordingly, y values of the data points do not depend on their x values, they are uncorrelated!
- Quite often a best-fit line can be easily sketched by hand. But in the example of summer temperatures at the North Sea coastline discussed here the extent of an eventual temperature trend is not easy to estimate by visual inspection: the slope of a best-fit line remains uncertain
- A quantitative procedure using linear regression analysis is rather straightforward. With a few data points this can be done with a pocket calculator.
- In this example, a significant trend of the seawater temperature cannot be made out over the years of 2003 - 2008: the best-fit line has a slope close zo zero. In such a case the two examined features, i.e., the temperature and time, do not depend on each other: they are not correlated.
Related SEOS link
- Worksheet:
Temperature Trend in the Wadden Sea 2:
Linear Regression Analysis
as html page or as printable rtf file - Supplement 1 Point Clouds and Linear Regression Lines

