3. Resolution
Display of remote sensing data
Satellite images are not photographs but pictorial presentations of measured data. Satellite systems measure electromagnetic radiation in different "areas" or bands of the electromagnetic spectrum (e.g. in the visible or infrared range).
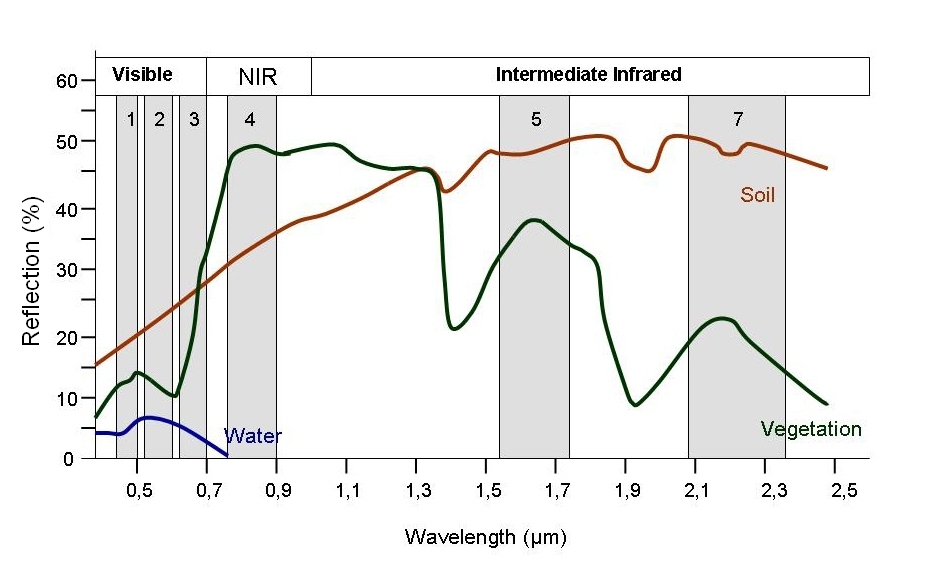
Separating the whole electromagnetic spectrum in different spectral bands has the advantage of combining these bands in various ways and therefore gain more information compared to solely panchromatic images (with only one band).
In each band, grey scales are assigned respectively to the intensity of the electromagnetic radiation and saved digitally in pixels. Through assigning the three fundamental colours (red, green and blue) to three different bands satellite image composites are produced.
As an example, the US satellite LANDSAT 7 possesses 8 bands. With a band combination of 3, 2, 1 an apparently natural image or true colour satellite image is produced.
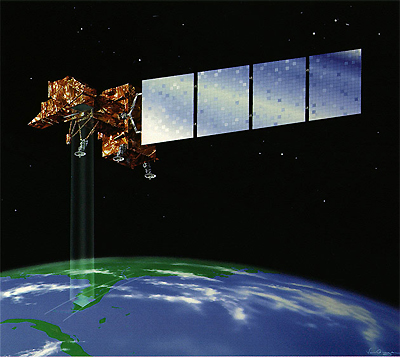
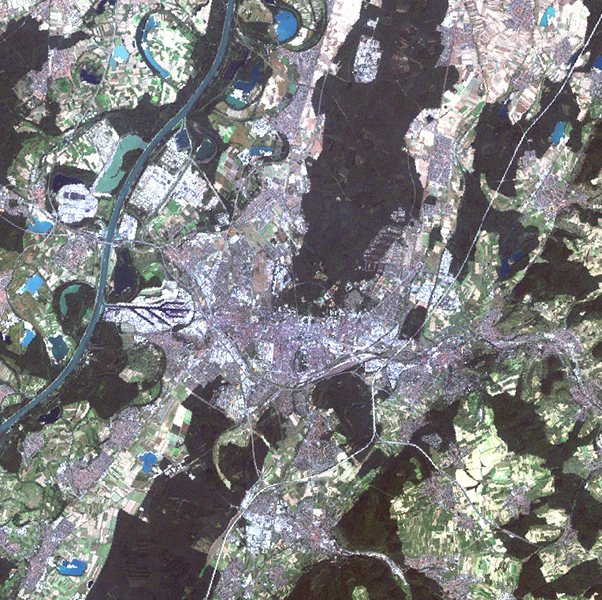
Source: Landsat
More features or earth surface structures can be detected through other bands or band combinations. These include water bodies, different vegetation species or land use classes. Earth surface temperatures can be detected with thermal bands as well.
These other band combinations are so called false colour images. They show land cover types in "false" colour compared to what we see with our eyes (see LANDSAT false colour image examples in the switch-box below).
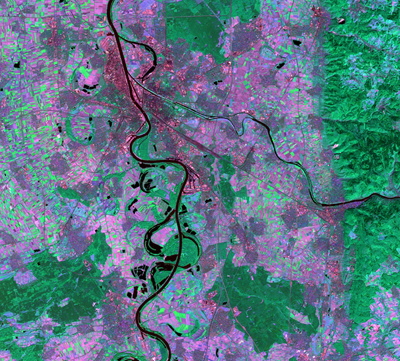
Source: Landsat
Other than assigning the three fundamental colours to different bands, mathematical operations applied to the raw data can provide more information. Artificial bands can be derivated, e.g. vegetation indices showing the plant vitality expressed through NDVI (Normalized Difference Vegetation Index).
