4. Vegetation Phenology
Time series of vegetation phenology
Does the annual vegetation index profile change over time?
The two figures shown on this page represent the phenology for Bobo Dioulasso and Toguere Koumbe in Africa, as indicated by their NDVI profiles. These locations are the two middle points of the four marked in the animation you watched in the last section.
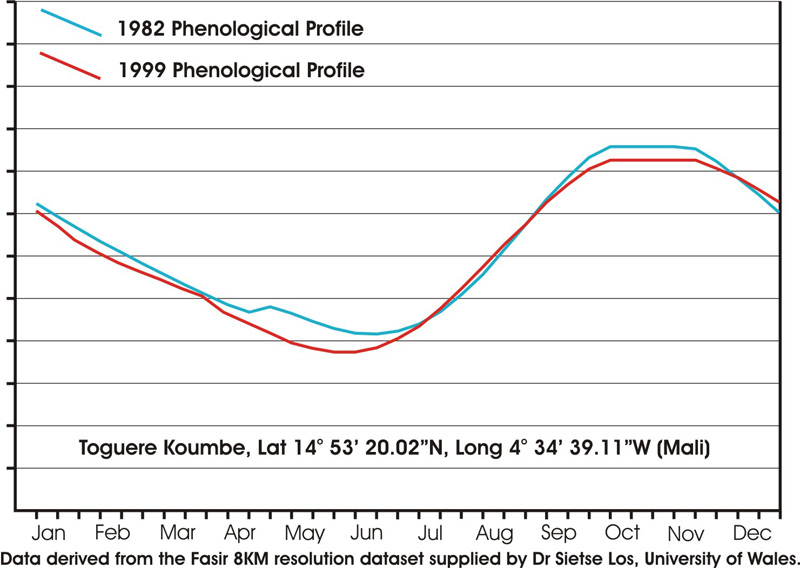
Timeseries phenology for Toguere Koumbe in 1982 and 1999.
As you can see the two profiles at Toguere Koumbe (above) are very similar, whilst there are marked differences between the two at Bobo Dioulasso (shown on the right).
- How similar, or how different, are are the two profiles?
- How can we know for sure?
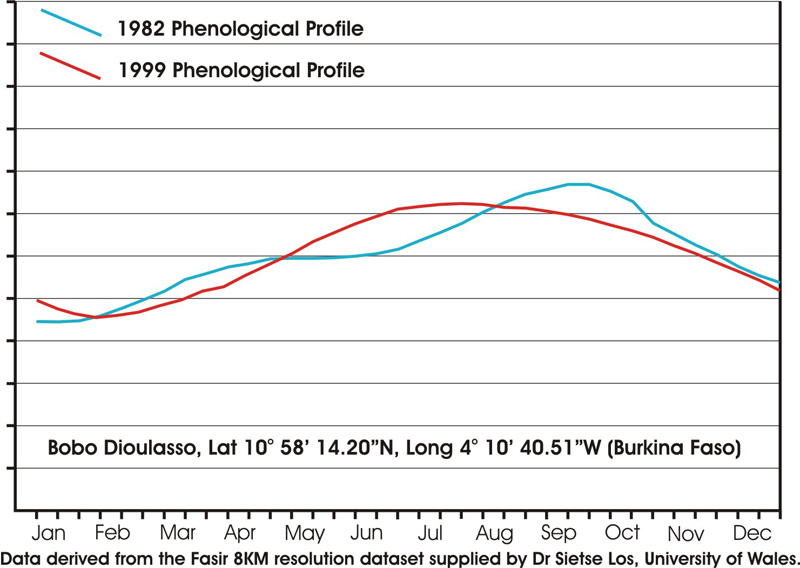
Timeseries phenology for Bobo Dioulasso in 1982 and 1999.
To answer these questions we can conduct a linear regression between the phenologies at the start and the end of the time series we get the results shown in the table below.
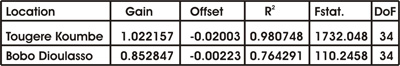
The data shown in the table confirms that the two phenologies for Tougere Koumbe are a close fit, since their Coefficient of Determination or R2 values are high. The gain is close to 1.0 and the offset is close to zero, so the regression line is nearly at 45° between the axes of the two datasets.
This is shown and discussed in more detail on the next page.
