5. Image Processing
Image enhancement
Why do we enhance satellite images? Different methods of image enhancement are used to prepare the "raw data" so that the actual analysis of images will be easier, faster and more reliable. The choice of method is dependent on the objective of the analysis. Two processes are presented below:
Histogram Stretches
In digital image processing the statistics of images are portrayed in a greyscale histogram (frequency distribution of grey values)
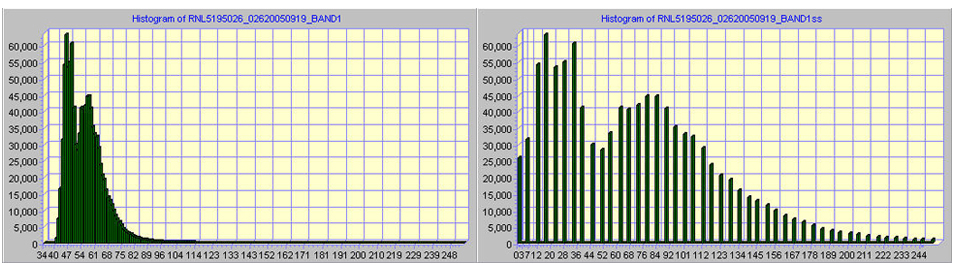
The form of a histogram describes the contrast range of a satellite image and permits comments about its homogeneity. For example, a grey scale distribution with an extreme maximum indicates small contrast. A simply stretched maximum indicates homogeneity in the image, but also a larger contrast range.
A histogram stretch is a method to process individual values in the image. The stretch is used as a contrasting presentation of the data. The contrast stretch can be used in many different processes. The entry data will always be stretched over the entire area of 0-255.
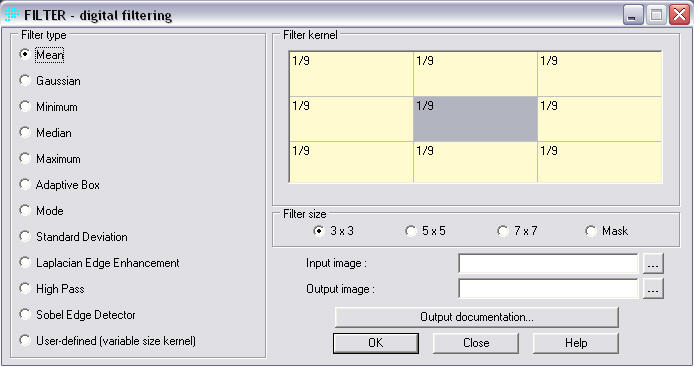
Filter
So called filter operations change image structures by calculating greyscale value relations of the neighbouring pixels. The filters use coefficient matrixes which cut a small area or matrix out of the original image centred on an individual image point. The filter/matrix then has to "run" over the entire image.
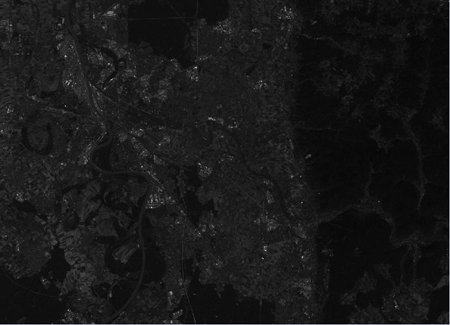
Source: Landsat