2. Windgedreven oppervlaktestromen
Het wereldwijde beeld
In dit hoofdstuk gaan we in op de door de wind aangedreven oppervlakte stromingen in de oceaan die de centrale gebieden van de open oceaan domineren. In de subtropen vormen deze stromingen enorme draaikolken met warme, snelle grensstromingen aan de westkant van de oceanen en langzame, koude grensstromingen aan de oostkant.
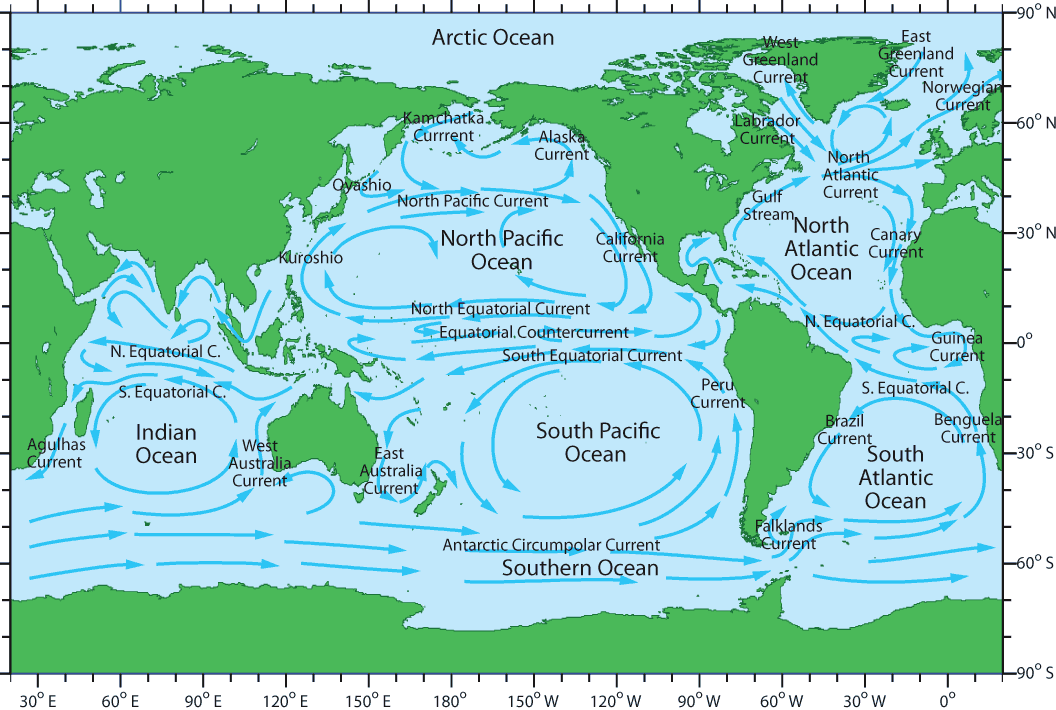
Op de bovenstaande kaart is het langetermijngemiddelde patroon van de oppervlakte stromingen in de oceanen weergegeven. Als je de kaart nader bekijkt, zou je de belangrijkste kenmerken moeten kunnen herkennen:
- Vijf subtropische gyres: twee in de Atlantische Oceaan, twee in de Stille Oceaan en één in de Indische Oceaan
- Een gordel van oostwaarts stromende equatoriale stromingen ten noorden en ten zuiden van de evenaar in alle drie de oceanen
- Zwakke equatoriale tegenstromen die de gyres van het noordelijk en zuidelijk halfrond in elke oceaan van elkaar scheiden
- Gordels van westwaarts stromende stromingenop de middelste breedtegraden: de belangrijkste die rond Antarctica in het zuidelijk halfrond stroomt, en twee kleinere gordels die door land naar het noorden worden afgebogen in de Noord-Atlantische Oceaan en de Noordelijke Stille Oceaan.
- Twee subpolaire gyres: één in de Noordelijke Stille Oceaan en één in de Noord-Atlantische Oceaan
Dit wereldwijde patroon ontstaat door de wisselwerking tussen de heersende (gemiddelde) winden, de rotatie van de aarde en de vorm van de oceaanbekkens. In de rest van dit hoofdstuk wordt bekeken wat deze stromingen bepaalt en worden hun kenmerken nader onderzocht.
Waarom is het verschil zo groot?
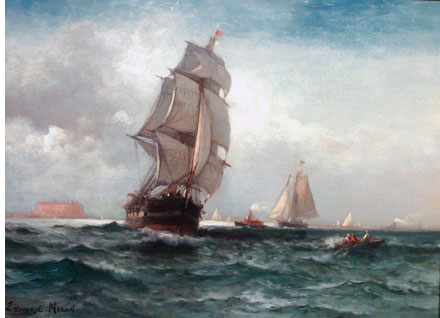
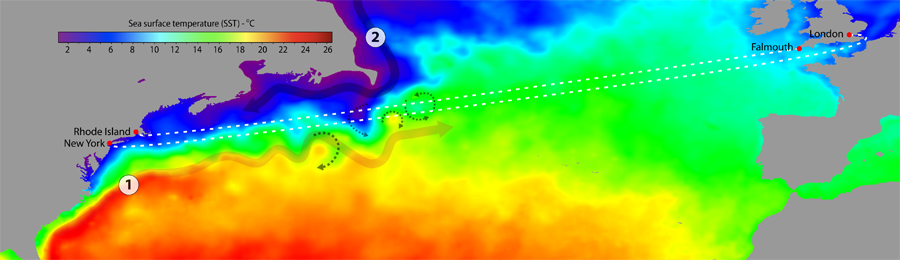
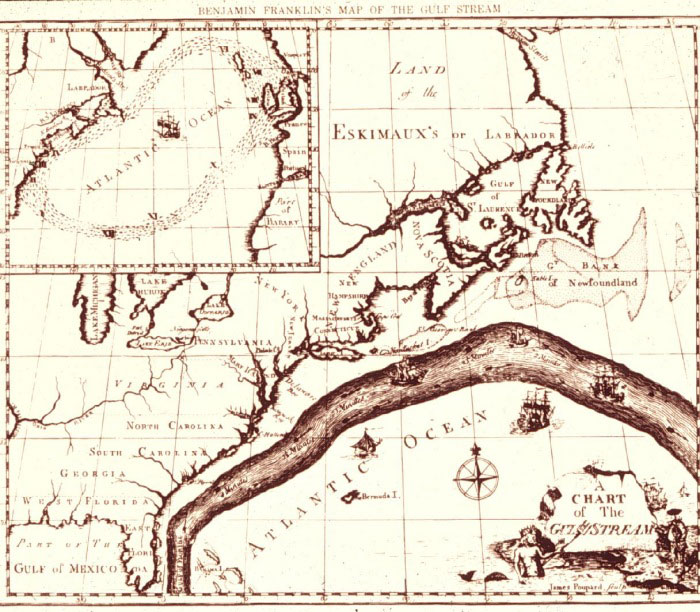
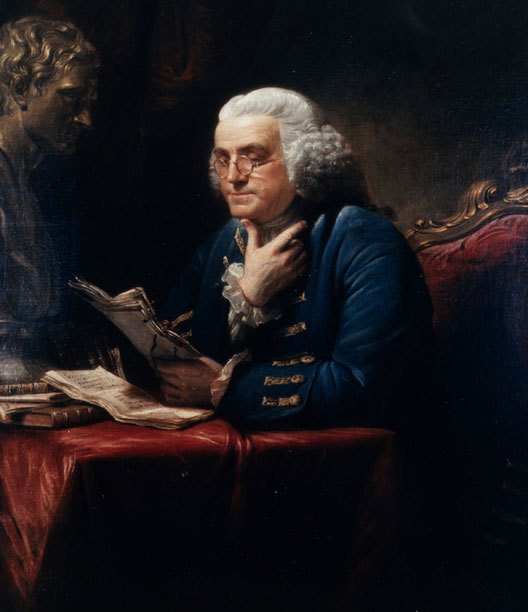
In de 18e eeuw deden postschepen van Londen naar New York er twee weken langer over dan koopvaardijschepen van Falmouth naar Rhode Island. Benjamin Franklin kwam erachter waarom. Kun jij dat ook?
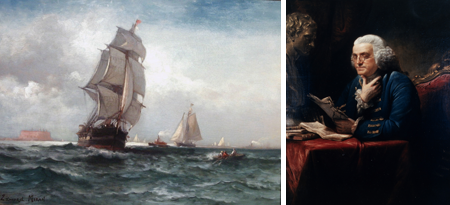 Links: De haven van New York in de 18e eeuw. Met dank aan
Vallejo Gallery.
Links: De haven van New York in de 18e eeuw. Met dank aan
Vallejo Gallery.Rechts: Benjamin Franklin. Met dank aan de National Science Foundation
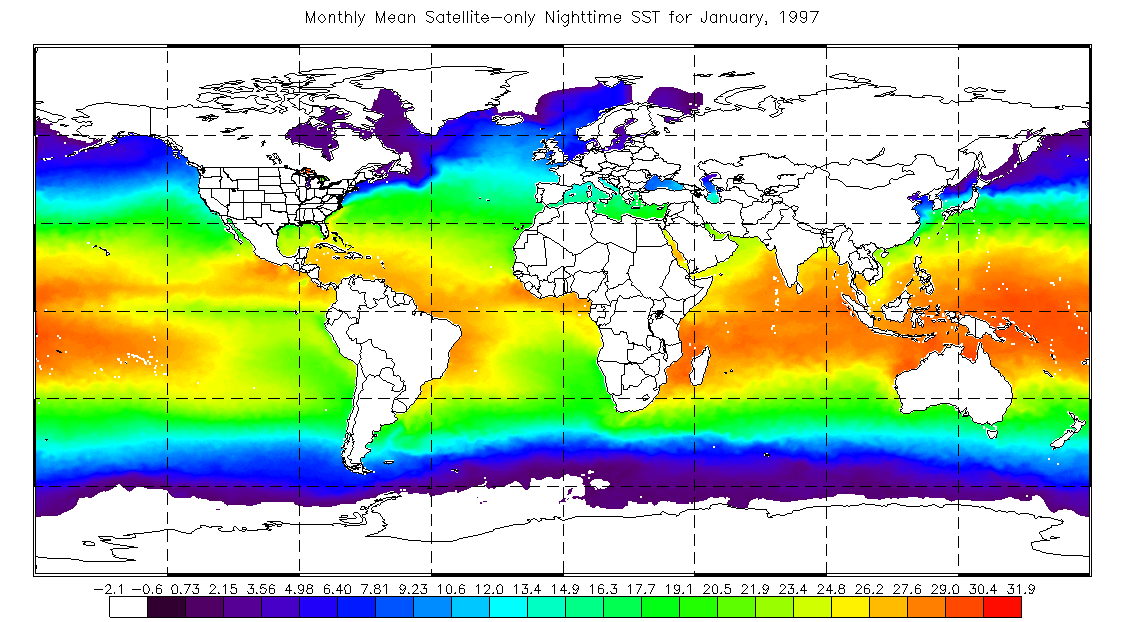
Het gebruik van satellieten om stromingen te bestuderen
Het gebruik van satellieten om stromingen te bestuderen De wereldwijde stromingspatronen zijn al enige tijd bekend. Dankzij satellieten is het nu eenvoudiger geworden om te onderzoeken hoe deze stromingen variëren per seizoen en van jaar tot jaar. Daardoor kunnen we nu veranderingen in oceaanstromingen in verband brengen met de aanwas van visbestanden, het verbleken van koraalriffen of veranderingen in weerpatronen die overstromingen of droogtes veroorzaken. El Niño – hieronder afgebeeld – is hier een voorbeeld van.
In dit hoofdstuk komen de volgende onderwerpen aan bod:
- De wereldwijde gordels van heersende winden
- De circulatie aan het oceaanoppervlak die door deze winden wordt aangedreven
- De oceaangyres die door de belangrijkste oppervlaktestromingen worden gevormd
- De westwaarts stromende stromingen op de middelste breedtegraden
