12. Image Credits
Chapter 1:
What are ocean currents and why are they important?
1. Topic Overview
Questions to ponder
Sailing in rough weather.
Reproduced with permission
Reproduced with permission
Oil tanker.
Wikimaedia Creative Commons
Wikimaedia Creative Commons
Last access: 18.08.2008
Eggborough Power Station.
Geograph
Geograph
Last access: 14.08.2008
licensed for reuse under this Creative Commons Licence
Winter landscape.
Trichodesmium bloom.
D. Ohnemus
D. Ohnemus
Last access: 19.08.2008
Reproduced with permission.
Sea ice paradox: photographs and figures in pop-ups
The Noorderlicht sails through sea ice during the 2007 Art/Science Expedition.
Cape Farewell
Cape Farewell
Last access: 21.04.2009
2007 Arctic Sea Ice from AMSR-E with Greenland in Foreground.
Publisher: NASA GSFC
Publisher: NASA GSFC
Last access: 21.04.2009
2007 Arctic Sea Ice from AMSR-E with Alaska in Foreground (Animation).
Publisher: NASA
Publisher: NASA
Last access: 20.04.2009
Surface currents in the Arctic.
Publisher: National Oceanography Centre Southampton
Publisher: National Oceanography Centre Southampton
URL:
http://www.noc.soton.ac.uk/o4s/euroargo/currents.kml/ (Needs Google Earth installed)
Last access: 25.04.2009
Bottom image
1.2 - Nike Trainers and Rubber Ducks
Nike trainer cartoons
Nike trainer cartoons, map and rubber duck photo.
NOCS
NOCS
1.3 - Rivers in the Sea
Current maps
The Gulf Stream. Ocean Surface Currents
CIMAS, University of Miami
CIMAS, University of Miami
Last access: 01.09.2009
The Canary Current. Ocean Surface Currents
CIMAS, University of Miami
CIMAS, University of Miami
Last access: 01.09.2009
Transport by currents
NOCS
NOCS
1.4 - How Currents affect us (1)
Shipping and marine offshore industries
Cargo Ship passing through Southport near the mouth of the Cape Fear River
Wikimedia Commons
Wikimedia Commons
Last access: 01.09.2009
Voe Viking cable laying
Delta Marine
Delta Marine
Last access: 01.09.2009
Offshore operations depend on timely ocean data
NASA JPL
NASA JPL
Last access: 03.09.2009
Dive buddy in deep green kelp forest
Wikimedia Commons
Wikimedia Commons
Last access: 03.09.2009
Ocean forecasts
North Atlantic forecasts 20/8-2/9 2008: Current velocity, SST and salinity maps
MERCATOR
MERCATOR
Last access: 22.08.2009
Fisheries and aquaculture
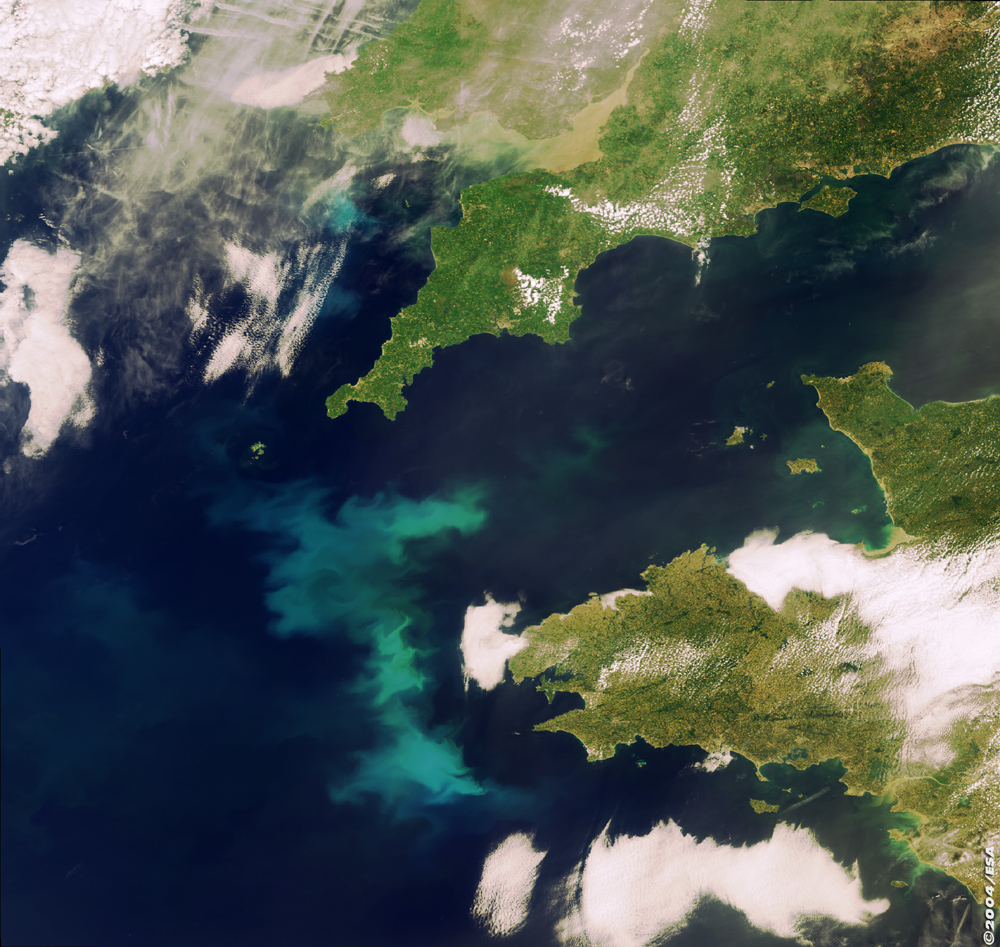
Algal bloom in the English Channel
ESA
Full image (528 K)
ESA
Last access: 24.08.2009
Mussels killed by harmful algal bloom
University of Cape Town
University of Cape Town
URL: n/a
Last access: n/a
Fishing in Ghana
Institute for Social, Behavioral and Economic Research (ISBER), University of California, Santa Barbara
Institute for Social, Behavioral and Economic Research (ISBER), University of California, Santa Barbara
Last access: 03.09.2009
Meroplankton: Larvae of lobsters, crabs and mussels
Oceans4schools, NOCS
Oceans4schools, NOCS
Last access: 03.09.2009
Conservation and resource management
Sediment from land-based sources of pollution covers coral near a wharf in Kanakakai
NOAA Coral Reef Conservation programme
NOAA Coral Reef Conservation programme
Last access: 03.09.2009
Sea turtle killed by entanglement in fishing net
NOAA Photo Library
NOAA Photo Library
Last access: 03.09.2009
Chlorophyll map of the area of turtle migration from Costa Rica to the South Pacific gyre
European Joint Research Centre, ISPRA
European Joint Research Centre, ISPRA
Last access: 28.08.2008
Leatherback movement in relation to ocean currents
PLOS Biology
PLOS Biology
Last access: 28.08.2008
Currents influence regional climate
West Bay, Mawson, Antarctica
Panoramio, Google Maps
Panoramio, Google Maps
Last access: 03.09.2009
Scoresby Sund, Greenland
Panoramio, Google Maps
Panoramio, Google Maps
Last access: 03.09.2009
A warm day on Vanna island
Panoramio, Google Maps
Panoramio, Google Maps
Last access: 03.09.2009
Aerial view of Limpopo River, Mozambique
Wikimedia
Wikimedia
Last access: 03.09.2009
Morning fog coming from the Atlantic Ocean, near Sossusvlei, Namib desert, Namibia
Wikimedia
Wikimedia
Last access: 03.09.2009
Global sea surface height anomalies in 1997 and 1999.
NASA
NASA
URL:
www.nasa.gov
Last access: 30.08.2008
Currents and regional climate game
Regional climate graphics with thumbnail photos
NOCS/Oceans4schools
NOCS/Oceans4schools
Last access: 30.04.2009
1.5 - Understanding and predicting ocean currents
Oahu North Shore surfers getting close.
Wikimedia
Wikimedia
Last access: 28.04.2009
Returning from a midnight walk .
Output of Seatrack Web Model for southeast Baltic on 25 October 2005.
Residual surface currents from the ~1.8km High-Resolution Continental Shelf application of POLCOMS.
NERC/POL
NERC/POL
Last access: 28.04.2009
Chapter 2: Wind-driven surface currents
2.1 Topic Overview
Map of global surface currents.
National Oceanography Centre, Southampton
National Oceanography Centre, Southampton
Monthly mean SST Charts from NOAA-AVHRR (Global).
National Oceanographic and Atmospheric Administration (NOAA)
National Oceanographic and Atmospheric Administration (NOAA)
Last access: 01.05.2009
Quiz: Why the big difference?
Shipping Off Governor's Island, New York Harbor.
Publisher: Vallejo Gallery
Publisher: Vallejo Gallery
Last access: 26.04.2009
The Gulf Stream by Benjamin Franklin.
NOAA Photo Library
NOAA Photo Library
Last access: 30.04.2009
Portrait of Benjamin Franklin.
National Science Foundation
National Science Foundation
Last access: 30.04.2009
Gulf Stream SST map in quiz pop-up.
National Oceanography Centre, Southampton
Produced with Bilko software from OSTIA SST data
National Oceanography Centre, Southampton
Produced with Bilko software from OSTIA SST data
2.2 Prevailing winds
Tall ship.
National Oceanography Centre, Southampton
National Oceanography Centre, Southampton
Wind ripples on larger waves.
National Oceanography Centre, Southampton
National Oceanography Centre, Southampton
Wind cartoon.
National Oceanography Centre, Southampton
National Oceanography Centre, Southampton
2.3 Global wind and current patterns
Sea surface temperature and current maps.
National Oceanography Centre, Southampton
National Oceanography Centre, Southampton
2.4 The Ocean Gyres
Current map.
National Oceanography Centre, Southampton
National Oceanography Centre, Southampton
Ocean gyre cartoon.
National Oceanography Centre, Southampton
National Oceanography Centre, Southampton
2.5 The Southern Ocean
The clipper Red Jacket sailing through ice off Cape Horn on her passage from Australia to Liverpool August 1854.
Australian Maritime Museum
Australian Maritime Museum
Last access: 10.09.2009
Sailing through a storm in the Southern Ocean.
Rick Tomlinson Photography
Rick Tomlinson Photography
Last access: 10.09.2009
Chapter 3: The global conveyor
3.1 Topic overview
Northcape Atlantic SST from satellites for January 2008.
National Oceanography Centre, Southampton
Produced with Bilko software from OSTIA SST data
National Oceanography Centre, Southampton
Produced with Bilko software from OSTIA SST data
Quiz: Why is Murmansk ice free all year
Murmansk Commercial Seaport - Gallery.
Publisher: Murmansk Commercial Seaport
Publisher: Murmansk Commercial Seaport
Last access: 24.04.2009
Northcape Current SST map in quiz pop-up.
National Oceanography Centre, Southampton
Produced with Bilko software from OSTIA SST data
National Oceanography Centre, Southampton
Produced with Bilko software from OSTIA SST data
3.2 The global conveyor
Earth's Radiation Budget.
National Oceanography Centre Southampton
National Oceanography Centre Southampton
Map of the wind driven surface circulation.
National Oceanography Centre Southampton
National Oceanography Centre Southampton
The global thermohaline circulation.
UNEP/GRID-Arendal
UNEP/GRID-Arendal
Last access: 16.05.2009
3.3 The high latitude engine rooms
Vertical structure of Atlantic water.
National Oceanography Centre Southampton
National Oceanography Centre Southampton
The North Atlantic Conveyor.
National Oceanography Centre Southampton
National Oceanography Centre Southampton
Modelled sea surface temperature.
National Oceanography Centre Southampton
National Oceanography Centre Southampton
Satellite SST and currents.
National Oceanography Centre Southampton
National Oceanography Centre Southampton
ASAR mosaic of Antarctica.
European Space Agency
European Space Agency
Last access: 29.10.2009
Coastal upwelling of cold water.
National Oceanography Centre Southampton
National Oceanography Centre Southampton
3.4 The conveyor and global warming
Marine snow.
National Oceanography Centre Southampton
National Oceanography Centre Southampton
Map of global surface salinity.
NASA Goddard Space Flight Centre
NASA Goddard Space Flight Centre
Last access: 16.05.2009
The global carbon cycle.
UNEP/GRID-Arendal
UNEP/GRID-Arendal
Last access: 28.10.2009
Will rising temperature slow the conveyor?
Northward heat transport in the Atlantic.
National Oceanography Centre Southampton
National Oceanography Centre Southampton
Northward heat transport in the Atlantic.
National Oceanography Centre Southampton
National Oceanography Centre Southampton
Difference in surface air temperature between pre-industrial and year 2050 with global warming..
Met Office, Hadley Centre for Climate Prediction and Research
Met Office, Hadley Centre for Climate Prediction and Research
Changes in precipitation with a complete shut-down of the Atlantic..
Met Office, Hadley Centre for Climate Prediction and Research
Met Office, Hadley Centre for Climate Prediction and Research
Deploying moored instruments in the RAPID array.
Natural Environment Research Council
Natural Environment Research Council
Atlantic circulation at present + A possible future?.
Natural Environment Research Council
Natural Environment Research Council
Melting of the Greenland Ice Sheet.
NASA/Goddard Space Flight Center
NASA/Goddard Space Flight Center
Last access: 28.10.2009
Chapter 4: Currents and life in the ocean
4.1 Topic overview
SeaWiFS: Gulf Stream.
NASA Visible Earth
NASA Visible Earth
Last access: 11.09.2009
MODIS: Temperature and Chlorophyll.
NASA Earth Observatory
NASA Earth Observatory
Last access: 13.9.09
Quiz pop-up
Photos of arctic birds.
National Oceanography Centre Southampton
National Oceanography Centre Southampton
Photo of predator.
Cape Farewell
Cape Farewell
Chlorophyll and temperature maps.
National Oceanography Centre Southampton, derived from NASA MODIS-Aqua data.
National Oceanography Centre Southampton, derived from NASA MODIS-Aqua data.
4.2 Phytoplankton: the grass of the sea
Arctic food web.
National Oceanography Centre Southampton
National Oceanography Centre Southampton
Deep Ocean Cafe.
National Oceanography Centre Southampton
National Oceanography Centre Southampton
North Atlantic Productivity.
National Oceanography Centre Southampton
National Oceanography Centre Southampton
Sunlight Cafe.
National Oceanography Centre Southampton
National Oceanography Centre Southampton
4.3 Ocean deserts
Phytoplankton cells.
National Oceanography Centre Southampton
National Oceanography Centre Southampton
Ocean chlorophyll map.
National Oceanography Centre Southampton, from NASA SeaWiFS data
National Oceanography Centre Southampton, from NASA SeaWiFS data
4.4 The fertile upwelling regions
Sea surface temperature map.
National Oceanography Centre Southampton, from NASA MODIS data
National Oceanography Centre Southampton, from NASA MODIS data
Ocean chlorophyll map.
National Oceanography Centre Southampton, from NASA MODIS data
National Oceanography Centre Southampton, from NASA MODIS data
4.5 The Benguela Current large marine ecosystem (BCLME)
Namibian Fisheries catch.
Benguela Current Large Marine Ecosystem Project
Benguela Current Large Marine Ecosystem Project
Dolphins feeding on sardines.
University of Cape Town
University of Cape Town
Fishing boatsnear Cape Town.
National Oceanography Centre, Southampton
National Oceanography Centre, Southampton
Diamond mining vessel dredging off Namibia.
ABC News
ABC News
Last access: 29.10.2009
Sea surface temperature for 3 Feb 2008.
National Oceanography Centre, Southampton
National Oceanography Centre, Southampton
Rock Lobster Walk-out.
University of Cape Town
University of Cape Town
Sulphur eruptions off the coast of Namibia.
NASA Goddard Space Flight Centre
NASA Goddard Space Flight Centre
Last access: 29.10.2009
Chapter 5: Local currents
5.1 Topic overview
Beached Boat.
Wikimedia
Wikimedia
Last access: 11.9.09
M2 tidal component.
Earth and Space Research
Earth and Space Research
Last access: 11.9.09
5.2 Tides and Tidal Currents
SeaGen.
Wikimedia Commons
Wikimedia Commons
Last access: 11.9.09
Severn Bore.
BBC
BBC
Last access: 11.09.09
Strait of Gibralter, Solitons.
The Lunar and Planetary Institute, NASA
The Lunar and Planetary Institute, NASA
Last access: 11.9.09
5.3 Rivers and Currents
MISR image, Mouth of the Amazon.
NASA Visable Earth
NASA Visable Earth
Last access: 11.9.09
MODIS AQUA images showing chllorophyl concentration on and the natural colour Amazon plume.
NASA Earth Observatory
NASA Earth Observatory
Last access: 11.9.09
SeaWifs animation.
NASA Goddard Space Flight Center
NASA Goddard Space Flight Center
Last access: 11.9.09
Chapter 6: Measuring ocean currents
6.1 Topic overview
Jason Satellite.
TOPEX project
TOPEX project
Last access: 12.9.09
Sea Surface Height.
NASA, GSFC, Remote Sensing Tutorial
NASA, GSFC, Remote Sensing Tutorial
Last access: 12.9.09
Argo float map.
Wikimedia Commons
Wikimedia Commons
Last access: 12.9.09
RV James Cook.
NOCS
NOCS
Tall Ships.
National Maratime Museam, Wikimedia
National Maratime Museam, Wikimedia
Last access: 12.9.09
Ocean Bottom Pressure.
NASA/JPL
NASA/JPL
Last access: 12.9.09
Current Meter.
Wikimedia Commons
Wikimedia Commons
Last access: 12.9.09
Dye in the Chicago River.
Wikimedia Commons
Wikimedia Commons
Last access: 12.9.09
NOAA Safe Seas Drift Card.
NOAA Safe Seas
NOAA Safe Seas
Last access: 12.09.2009
ADCP Sensor Head.
NOAA Ocean Explorer
NOAA Ocean Explorer
Last access: 12.09.2009
1901 Cable Map.
Wikimedia
Wikimedia
Last access: 12.09.2009
Additional material
The Coriolis Effect
Prevailing Winds
Vertical circulation in the atmosphere.
National Oceanography Centre Southampton
National Oceanography Centre Southampton
Diagram of the main wind belts.
National Oceanography Centre Southampton
National Oceanography Centre Southampton
Meteosat Fulldisk Global Satellite Images.
NOAA-GOES/
NOAA-GOES/
Last access: 29.10.2009
Southern Ocean
Highs and lows in the Southern Hemisphere in 2001.
Wind speed maps.
National Oceanography Centre Southampton
National Oceanography Centre Southampton
Sea Surface Height variability map with Argo float positions.
National Oceanography Centre Southampton
National Oceanography Centre Southampton
Wind driven upwelling
Upwelling diagrams.
National Oceanography Centre Southampton
National Oceanography Centre Southampton
More Upwelling - the Southern Ocean and elsewhere
SeaWiFS Image.
NASA Goddard Space Flight Centre
NASA Goddard Space Flight Centre
Jason and the Argo Float
Argo float diagram and Argo float map.
Argo Deployment.
National Oceanography Centre Southampton
National Oceanography Centre Southampton
Argo floats - operation and data
Argo 10-day float cycle.
Argo float trajectory and data plots.
Coriolis, IFREMER
Coriolis, IFREMER
Geostrophic currents
Diagrams.
National Oceanography Centre Southampton
National Oceanography Centre Southampton
The Geoid
Global geoid image.
European Space Agency
European Space Agency
Last access: 29.10.2009
The GRACE gravity model.
Oceanography Department, Texas A and M University
Oceanography Department, Texas A and M University
Last access: 29.10.2009
