Airborne Oil Pollution Patrol 3:
Interference Fringes of Oil on Water
Scenario
When measuring the microwave emission (1 ... 100 GHz frequency range) of seawater in the area of
large oil spills, one obtains maxima and minima of the signal intensity at specific
thickness values of the oil layer on the sea surface (see graph below). This is due to constructive
and destructive interference in the oil layer which is transparent in the microwave range and therefore
depends on the frequency (or: wavelength) used. This effect is used to map oil layers on the sea surface
with scanning microwave radiometers (right images).
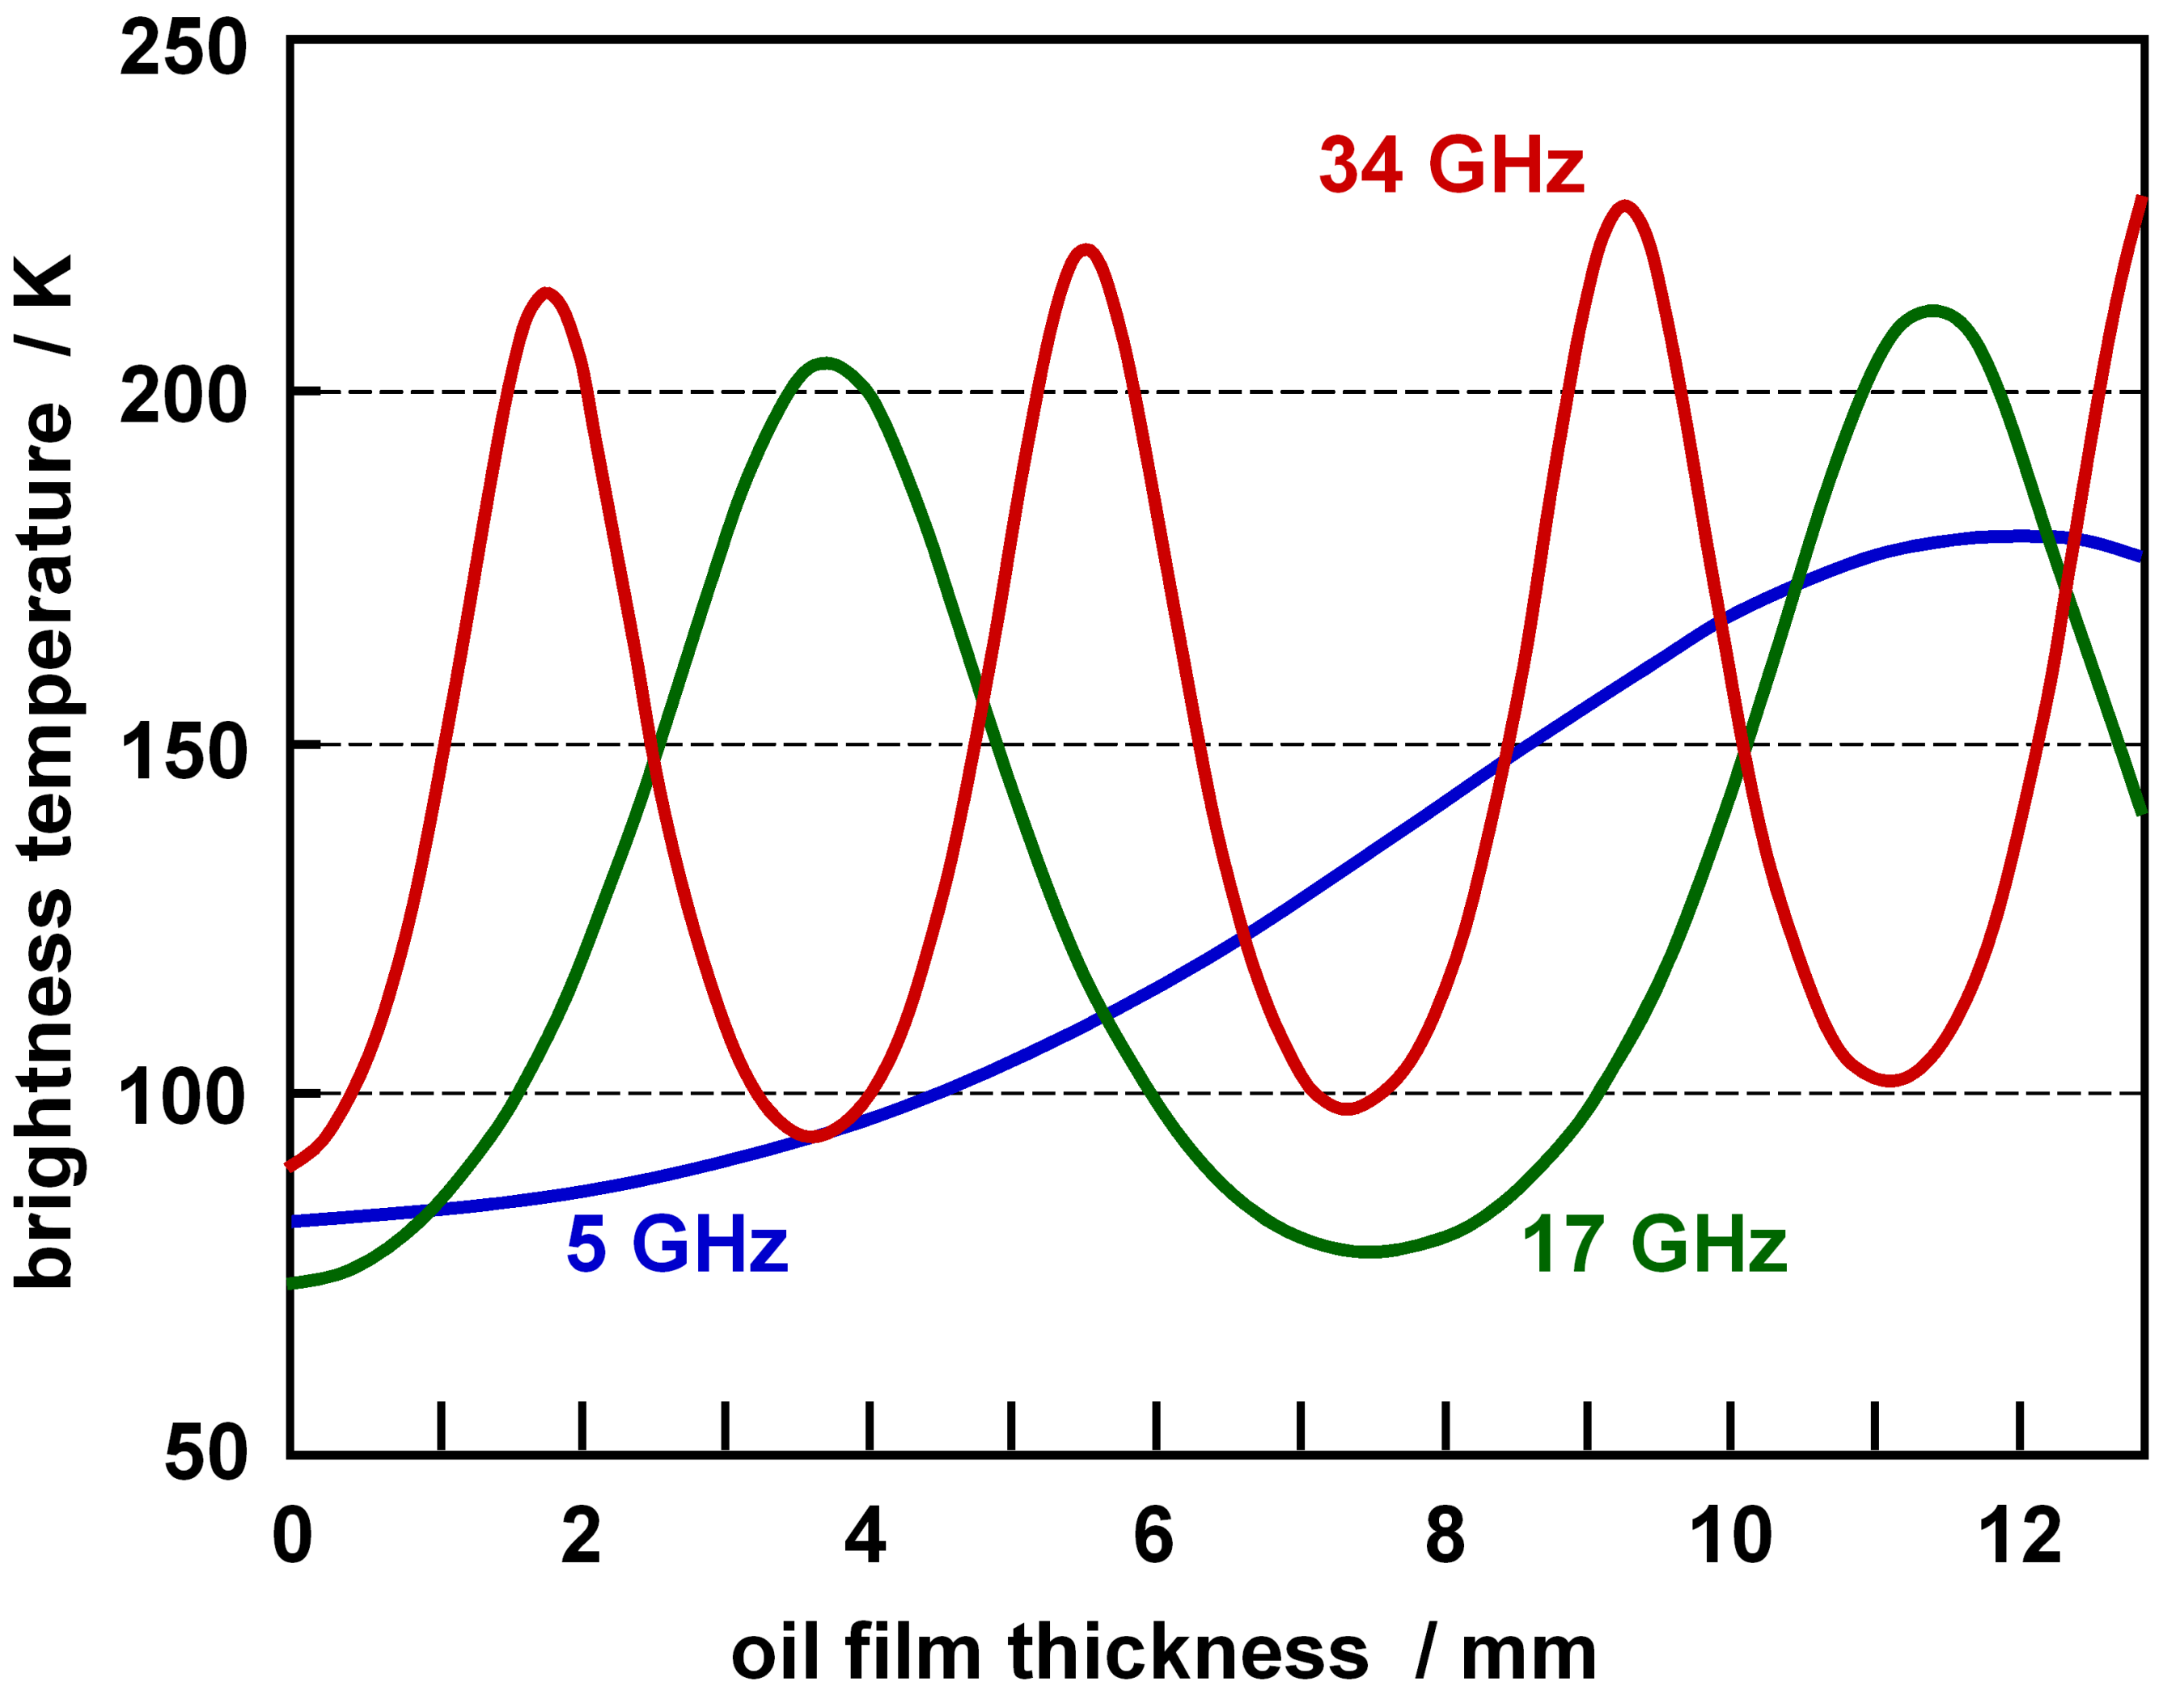
Brightness temperature of oil given in absolute temperatures (Kelvin scale) as a function of the oil film thickness
in millimetres, shown for three frequencies in the microwave range. The angle of incidence of the radiometer
field of view on the oil surface is 41° (5 GHz), 54° (17 GHz), and 50° (34 GHz).
|
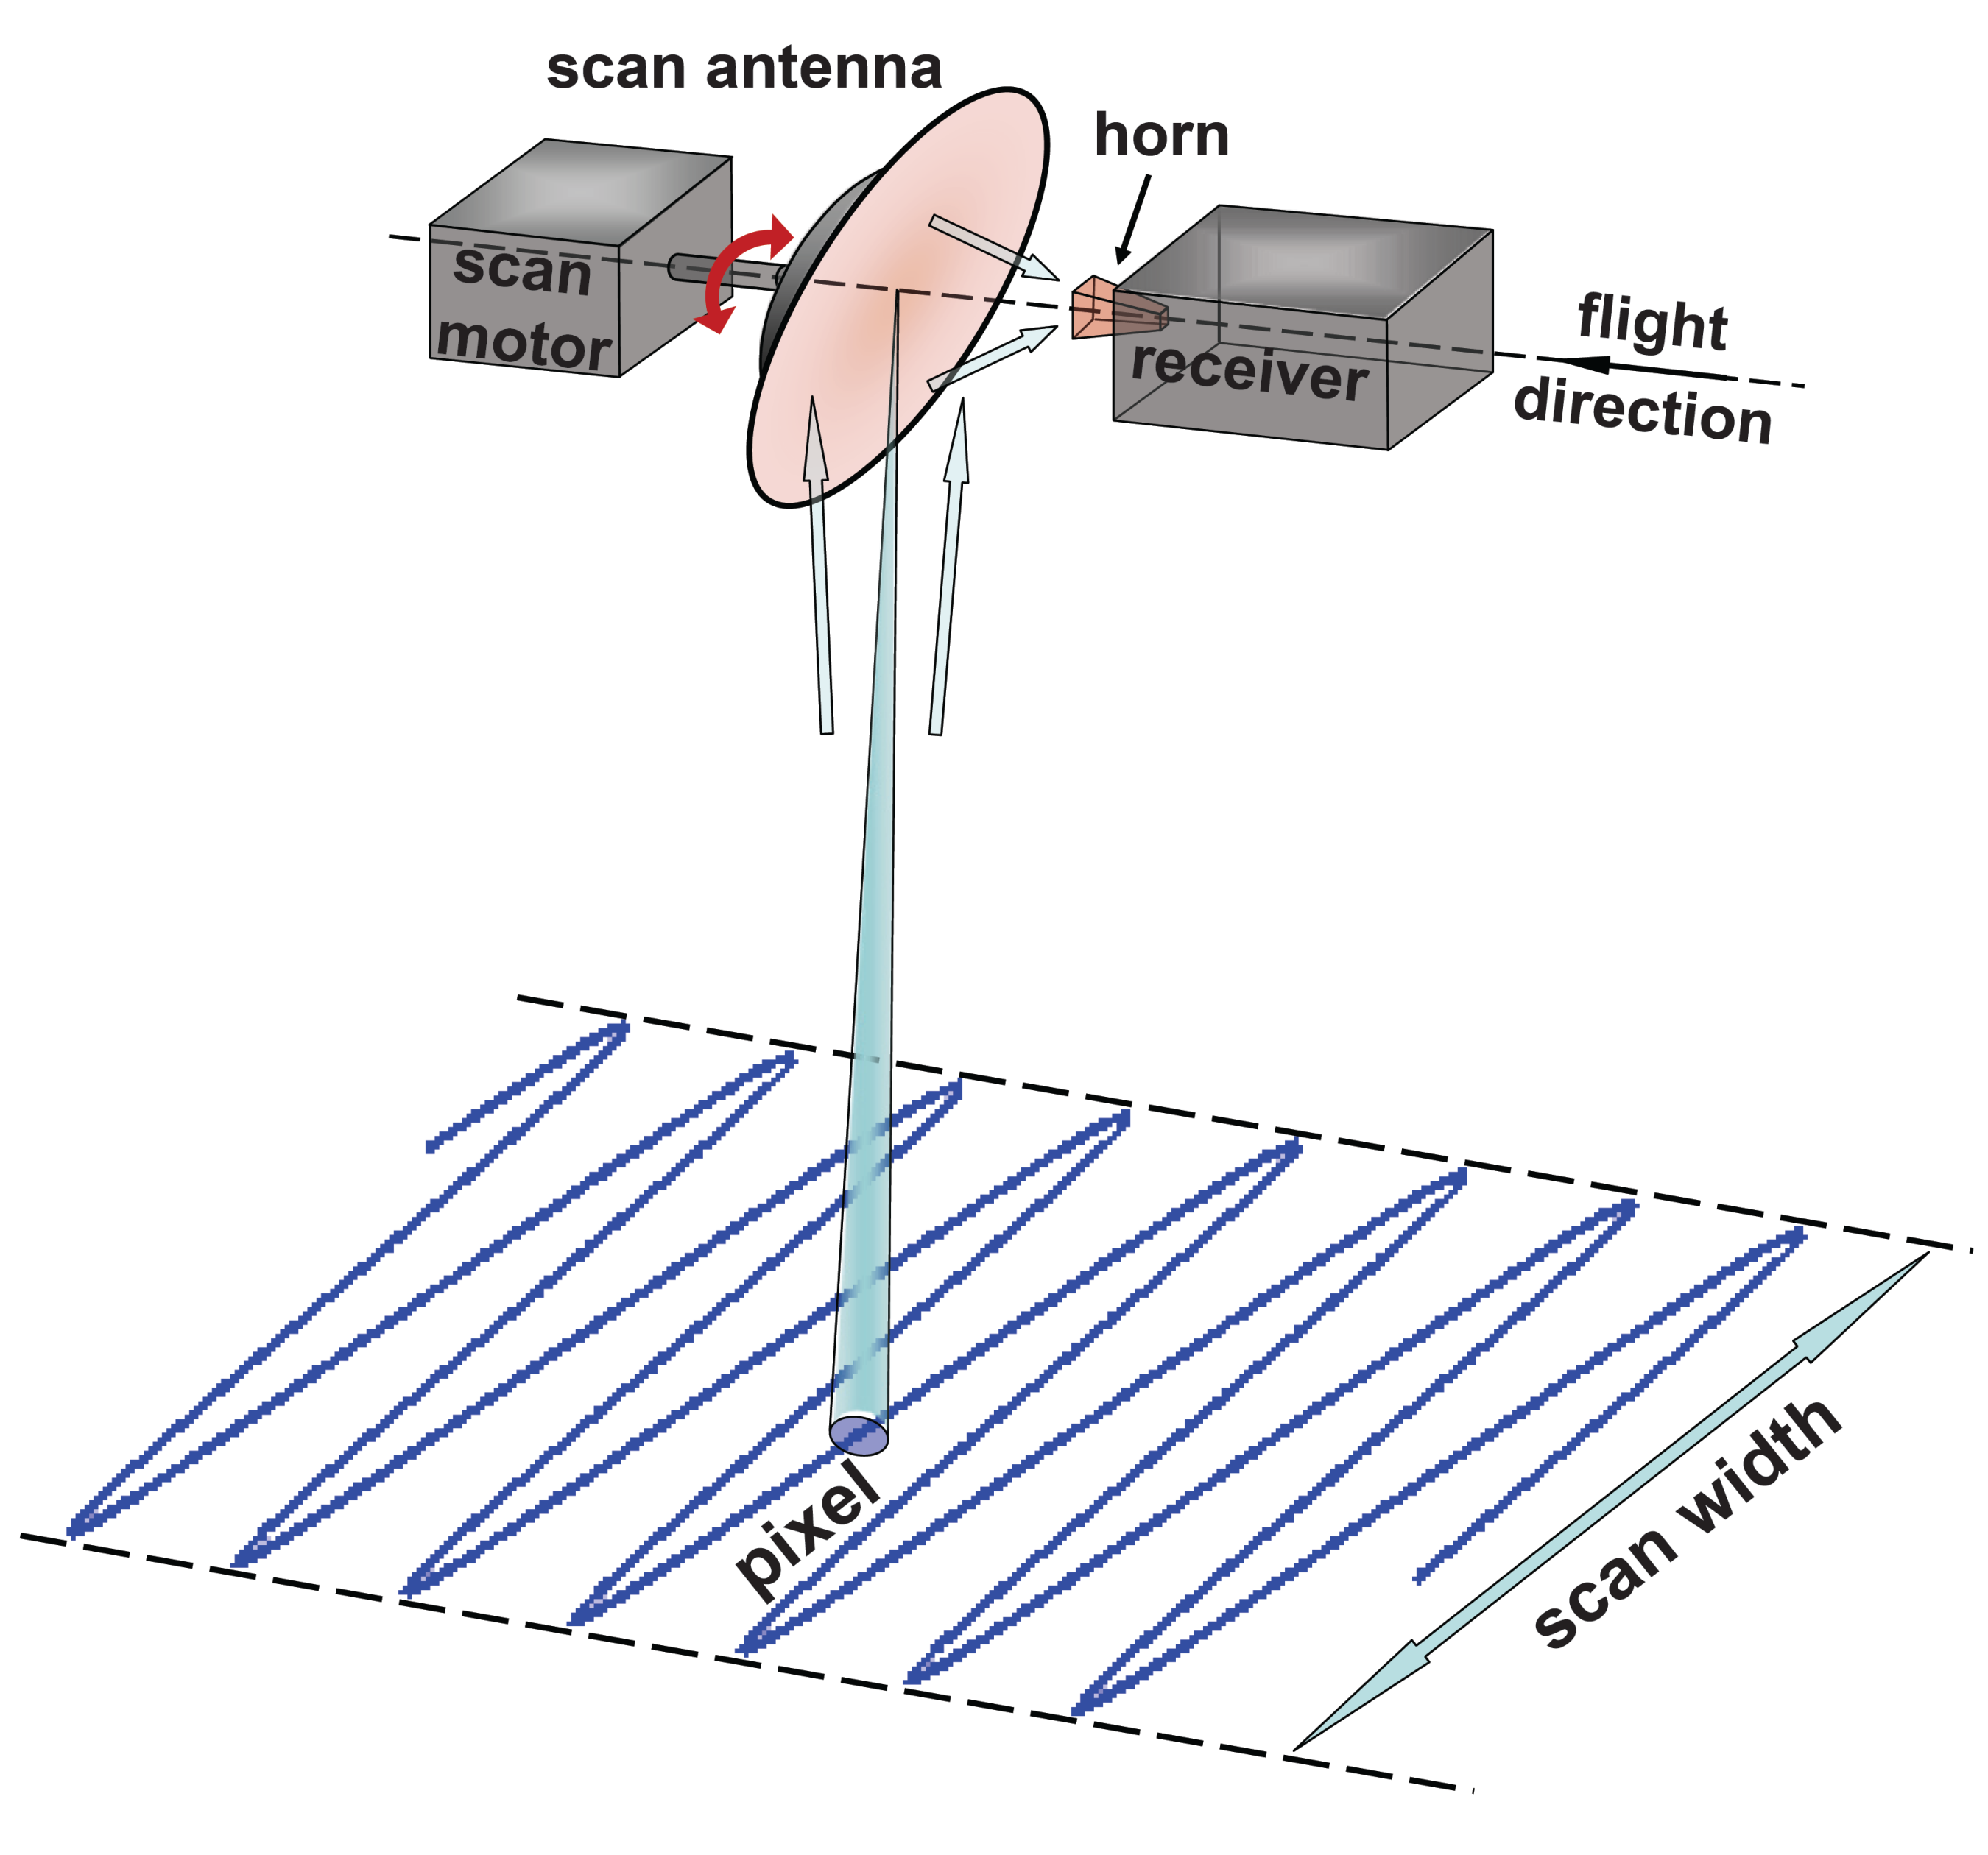
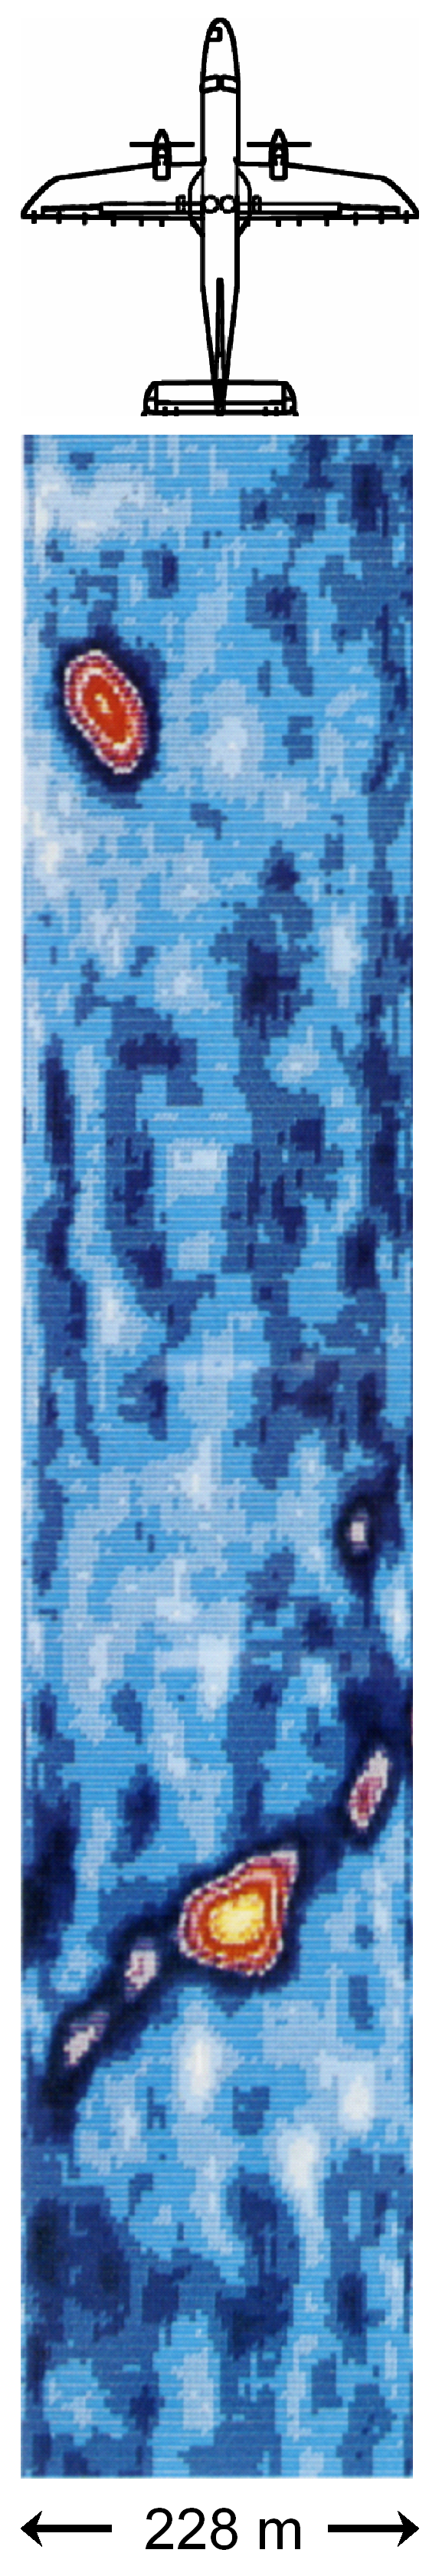
Left image: Geometry of microwave radiometer scanning operation. Right image: Heavy fuel oil slick
with a total volume of 17 m3, measured with a 32 GHz MWR Scanner. The angle of incidence of the radiometer
field of view on the sea surface is 40°. The maximum brightness temperature variation is 17 K.
|
In the microwave spectral region, oil and seawater have the following properties:
- Oil is transparent and hence non-absorptive. Because of Kirchhoff’s Law it does not emit thermal radiation. The relative permittivity of mineral oils is εr=2.0 in the microwave spectra range, and it follows for the refractive index: n=1.41 (see supplement 3 of SEOS tutorial Understanding Spectra from the Earth).
- Because of its high electrolytic conductivity due to dissolved salt ions, seawater is highly absorptive and therefore not transparent for microwaves. The relative permittivity of seawater is εr=90, and it follows for the refractive index: n=9.4 (in the visible spectral range it is n=1.33). The water surface emits thermal radiation because of the high absorbance, again in accordance with Kirchhoff’s Law. The spectral distribution follows Planck’s Radiation Law with a maximum in the infrared at wavelengths around 10 μm. Here we consider only the portion which is in the microwave range. It comes from the top layer of the seawater whose thickness is in the order of the wavelength, that is, a few centimetres approximately.
|
To better understand the interference fringes, we consider microwave emission by seawater and an oil layer at the
water surface. The wave propagates through the oil and is partially reflected at
the oil-atmosphere and the oil-water interface. We investigate the waves which are finally refracted into the air
and propagate towards the detector of the microwave antenna.
We consider a path of rays with an incidence angle α and a refractive angle β
at the oil-water interface. The oil layer has a constant thickness d. The waves are partly reflected
and transmitted at the oil-atmosphere interface, the incidence and refraction angles are β and
γ. The field of view of the microwave radiometer has an angle of incidence at the sea surface which is assumed to be γ.
Following Snell’s law of reflection, both the incidence and reflection angle at point B are
β. The same holds at point C, and also with the incidence angle at point D,
because of the parallel water-oil and oil-atmosphere interfaces.
The refraction angles of the waves at both interfaces, shown in the right graph,
follow from Snell’s law of refraction:
|
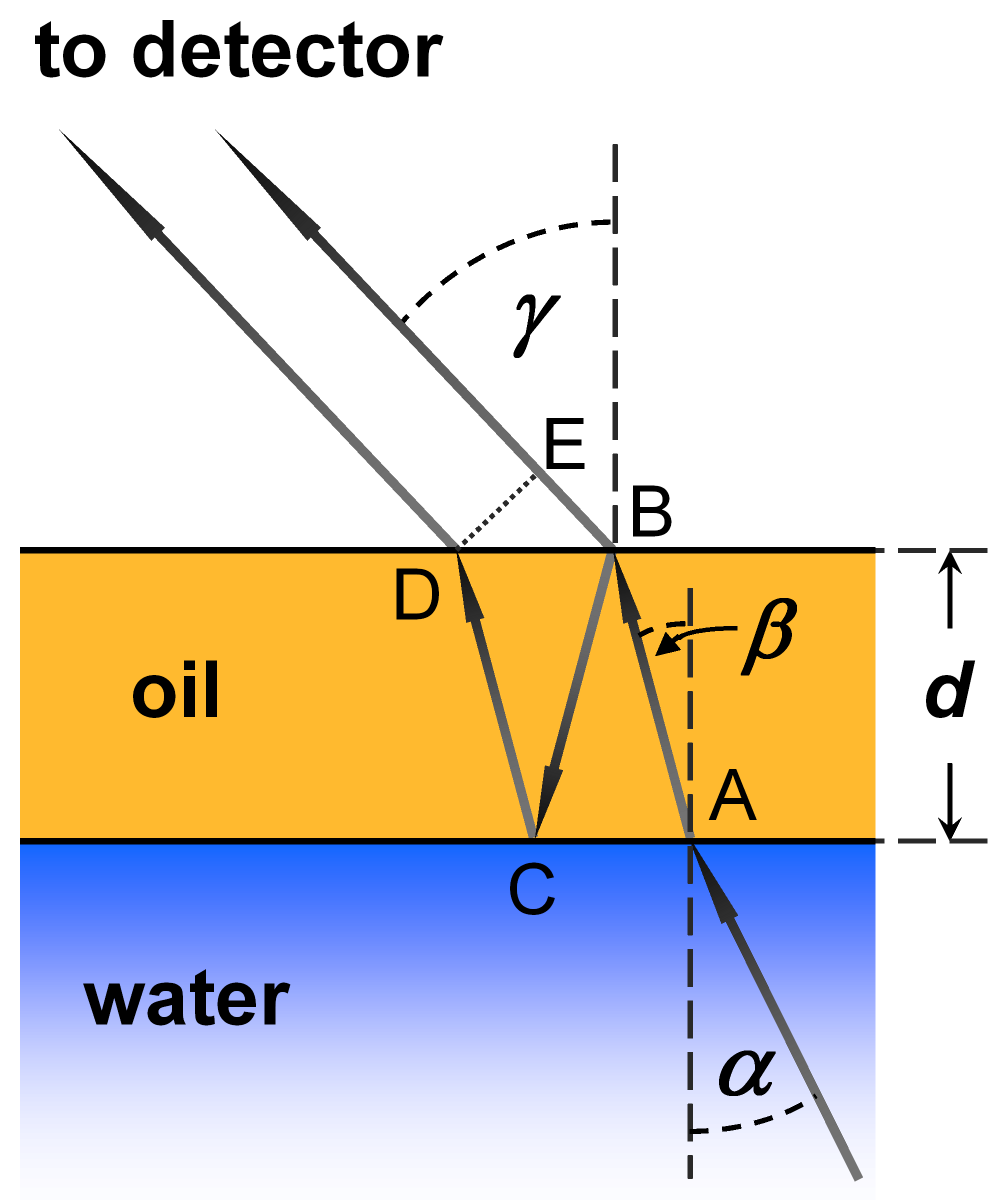
An oil layer with thickness d on the water surface, and microwaves with a path of rays directed towards
the detector of the microwave radiometer. Partial reflection at the oil-water-atmosphere interfaces leads to
interference fringes as shown in the graph on top of the page.
|
Questions
- Please sketch two waves starting at points B and C, having a phase which leads to constructive and destructive interference, and hence to maxima and minima of the detected signal, respectively.
- Calculate the wavelength of microwaves in air and in oil, with frequencies of 5, 17 and 34 GHz. Are the wavelengths in a qualitative agreement with the oil film thickness values where maxima and minima of the brightness temperature is observed, as shown in the graph on top of the page?
- With the refractive indices of water and oil as given above, would you consider the incidence angle α and refractive angle β to be correctly sketched in the graph on the right? Check with Snell’s law of refraction! To do this, please start with γ=50°, which is a typical viewing angle of microwave radiometers (see caption of the right graph on top of the page), and calculate the angles β and α.
-
Can you recommend the MWR Scanner
a) to distinguish thin oil films caused by controlled spillages from larger oil volumes caused by accidental discharges?
b) for surveillance of deliberate discharges of small oil volumes of about 100 litres per nautical mile?
c) for a guidance of oil spill recovery vessels following accidental spillages of large oil volumes? - Oil discharged at sea undergoes weathering effects due to wind and waves. In particular, water droplets are mixed into the oil layer, leading to emulsification (‘chocolat mousse’). Is it possible to detect and quantify weathered oils on the sea surface with a MWR Scanner?
- Another effect of weathering is the evaporation of volatile oil compounds, leading to an increase of the density of oils. The density can thus exceed the density of seawater. Then the oil submerges and floats in the water column. Would it be feasible to detect submerged oil with a MWR Scanner?
Procedure
- First lesson in class: Get together in groups of no more than five students and
- discuss the questions about the physical characteristics of oils and their behaviour on the water surface,
- decide which background information you may need to solve the problem, and
- assign a task to each member of your group which should be resolved by the time of the next lesson in school.
This should enable you to solve the given problem and present the results to your class.
Please note: not all the backgound information offered to you is needed to solve the problem! It's up to you to decide which information you may need.
- Homework: Resolve the task that has been assigned to you by your group.
- Second lesson in class:
- present what you have learned to your group
- discuss how your findings can help you to answer question 4, i.e. the choice of best instruments and methods for a given scenario
- present your results to your class using the information found in your enquiries.
Materials
- Version of this worksheet: Interference fringes of oil on water, as printable rtf file
- Oil pollution and the fate of oil at sea
- Airborne maritime oil spill surveillance
- The Microwave Radiometer
- Supplement to this worksheet: Interference fringes of oil on water, as html page or as printable rtf file
