Supplement 2.18: The UV-IR Scanner
Principle of operation
IR/UV line scanners have been established as standard tools in airborne oil spill remote sensing for some time. They are capable of simultaneously mapping the total extent of the oil spill, from thin layers (> 0.01 μm thick) through to thick surface oil (> 100 μm thick). The instrument uses two different sensors:
- an optical detector sensitive to light in the near ultraviolet (UV) range, typically 320-380 nm, and
- an infrared (IR) detector sensitive to radiation in the thermal range, typically 8-12 μm.
Both sensors scan across-track as shown on the right, buidling up a row of pixels for each scan-line. The pixel size across-track is determined by the instantaneous field of view (IFOV) and the flight altitude; the pixel size along track is determined by the scan rate and flight velocity of the aircraft. Because the scan rate and IFOV is the same for both sensors, they produce co-registered images of the water surface.
Oil detection by measuring oil-water contrast
The UV and IR sensors operate in very different parts of the electromagnetic spectrum, so the physical principles behind oil detection is very different. The sensors measure different properties of the oil and surrounding water, and the range of natural phenomena (e.g. sunlight, air and water temperature, wind and waves) that may give rise to 'false positives' is generally different for the two sensors. This makes their combination a more reliable instrument for oil detection than either sensor on its own.
For oil spill monitoring the important parameter is oil-water contrast. This is usually defined as the signal from a patch of oil less the signal from surrounding water divided by the signal from the water. When the contrast is 0, oil cannot be detected; negative or positive contrast allows the oil to be detected if the contrast is greater than the noise level of the instruments.
Oil-water contrast in thermal IR images
Detection of surface oil in thermal data is based on very different physical principles from those responsible for oil water contrast in the UV part of the spectrum. Oil is detectable in thermal images for two reasons:
- The thermal emissivity of oil is lower than that of water.
- The temperature of surface oil is often different from the temperature of the surrounding water.
 Blackbody radiation
All surfaces emit electromagnetic radiation in a wide spectral range. At typical sea surface temperatures the emission peak is at 9-11 μm. For an ideal blackbody the thermal radiation spectrum is determined by Planck's radiation law (see figure), and the emitted radiation is known as blackbody radiation. The intensity of radiation emitted by a real surface is mostly lower than the blackbody radiation and depends on the emissivity of the surface. The emissivity of sea water in the thermal IR is 98-99% of emissivity of a blackbody at the same temperature. The emissivity of oil is typically 94-97% depending on oil type and degree of weathering, so oil will appear cooler than water of the same temperature. Thinner oil films (‹ 50-1000 μm) are essentially in thermal equilibrium with the water, and will therefore give negative contrast. However, for oil films thinner than 1-2 times the wavelength of the radiation (10-20 μm) most of the emitted signal comes from the water underneath the oil, so the contrast is too low to be detected. The minimum detectable thickness range usually lies between 20 and 70 μm.
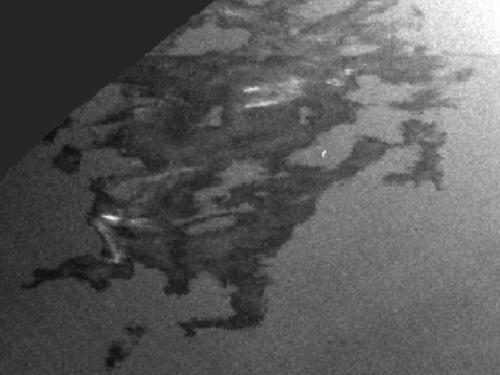 IR image of Forties crude
When oil is first released evaporation of volatile components will cool the surface so the oil may be cooler than its surroundings. Once the evaporation has stopped, thinner layers of oil will reach thermal equilibrium with the water.
But thicker oil may start to warm up. The absorption coefficient of oil is typically many thousand times higher than that of water at visible wavelengths (where solar radiation peaks). A layer of crude oil only 200-500 μm thick (depending on type and weathering) absorbs virually all radiation incident on the surface. Most of the radiant energy is converted to heat. Some of the heat is transferred to the air and water, but the thermal conductivity of oil is low, so thick oil will usually be warmer than the surrounding water during daylight hours.
At a certain thickness, the effect of the higher temperature will offset the effect of the lower oil emissivity, and the brightness temperature of the oil will be the same as the brightness temperature of the water. Above this threshold thickness, the oil will appear brighter than water in thermal images. The threshold thickness depends on the oil (absorption properties, weathering) and its environment (incident light, water and air temperatures, sea state etc.). Typically the transition occurs between 70 and 150 μm oil thickness.
Infrared sensors often fail to detect water-in-oil emulsions. This is probably because they typically contain 70% water, so the difference in emissivity is small. The water in the emulsion also increases the thermal conductivity, so the oil is more likely to be in equilibrium with its surroundings.
A number of oil "look-alikes" may give rise to false identification of oil in thermal images. These include weeds, shorelines and oceanic fronts.
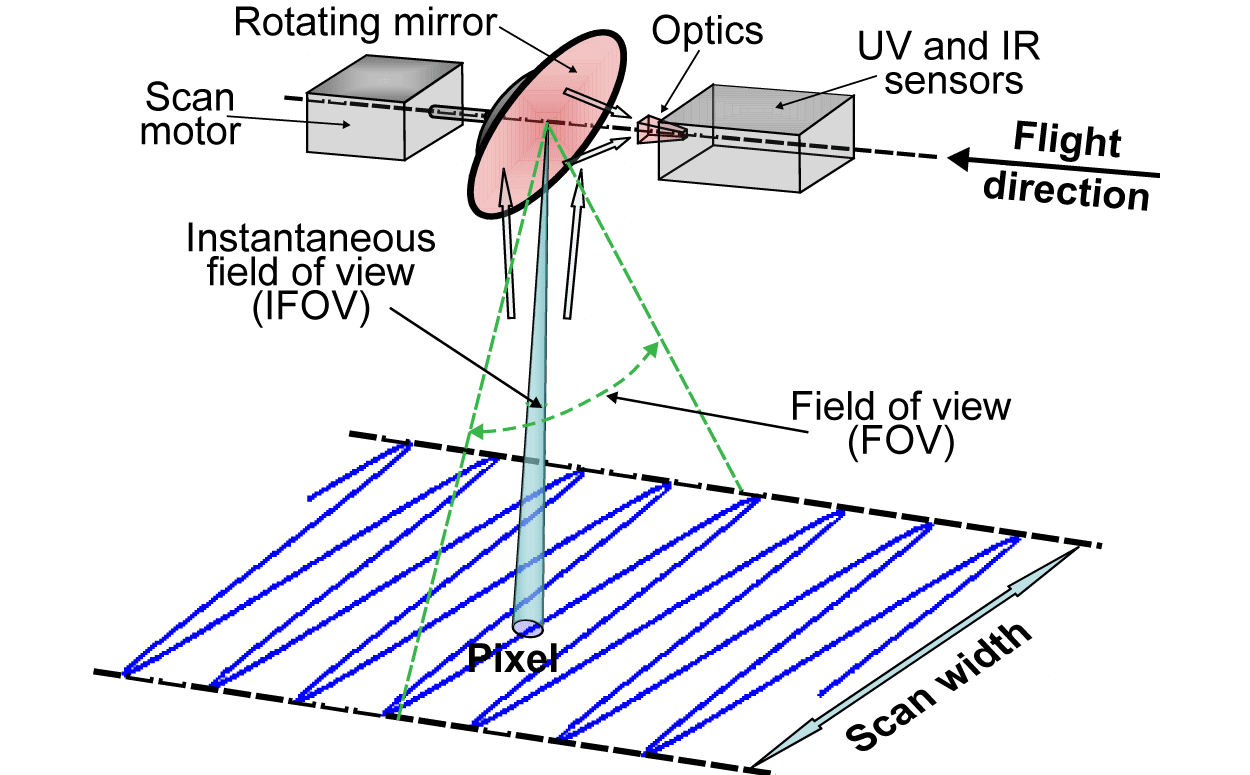 Geometry of the UV / IR line scanning operation
Typical sensor specifications:
- UV wave-band: λ = 320 - 380 nm
- IR wave-band: λ = 8 - 12 μm
- Scan method: across-track scanning
- Scan rate: 20 Hz (20 lines per second)
- Instantaneous Field of View (IFOV): 2.5 mrad (= 0.014°)
- Field of View (FOV): 90°
- Altitude of operation: ideally 1000 ft
Oil-water contrast in UV images
UV sensors detect surface oil because the optical properties of the oil are very different from those of the surrounding water:
- Oil has a higher refractive index than water, particularly in the UV; so surface oil reflects more of the incident light from sun and sky and appears brighter than the surrounding water.
- In bright sunlight UVA and UVB radiation can excite oil fluorescence at wavelengths of about 360nm and longer; this sunlight-induced fluorescence increases as the thickness of the oil increases.
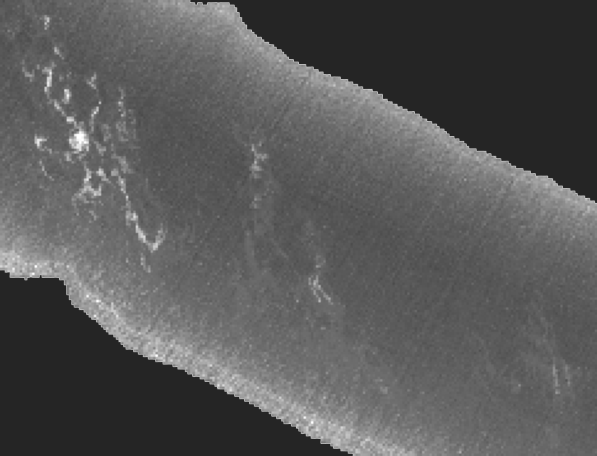 UV image of crude oil
Oil-water contrast in the UV is usually positive. A weak positive contrast may be detectable at thicknesses as low as 0.01μm in calm conditions. The contrast increases as oil thickness increases. In an oil layer a few micron thick, solar induced fluorescence may add to the brightness of the oil. Emulsified oil may appear particularly bright (strong positive contrast) Some UV sensors have a bandwidth that may include violet (390-450 nm) and blue (450-480 nm). This increases their sensitiity to solar induced fluorescence from crude oils, but reduces the sensor's ability to detect very thin oil.
Interpretation of UV data is not always straightforward. A number of phenomena may be mistaken for oil: these include wind slicks, foam or sunglint, cloud reflections and biogenic material. Detection is more reliable when it is corroborated by data from other sensor types.
UV/IR data fusion
Data fusion is the combination of data from different sensors to obtain information that may not be reliably obtained by single sensors alone. The technique of combining UV and IR images in oil spill detection is based on several decades of successful oil detection with UV and IR cameras and video cameras, and later with line scanners capable of producing geo-referenced digital images. Ultraviolet (UV) and thermal infrared (IR) sensors are sensitive to very different ranges of oil thickness, so by overlaying images from the two sensors reliable maps of relative oil thickness may be produced.
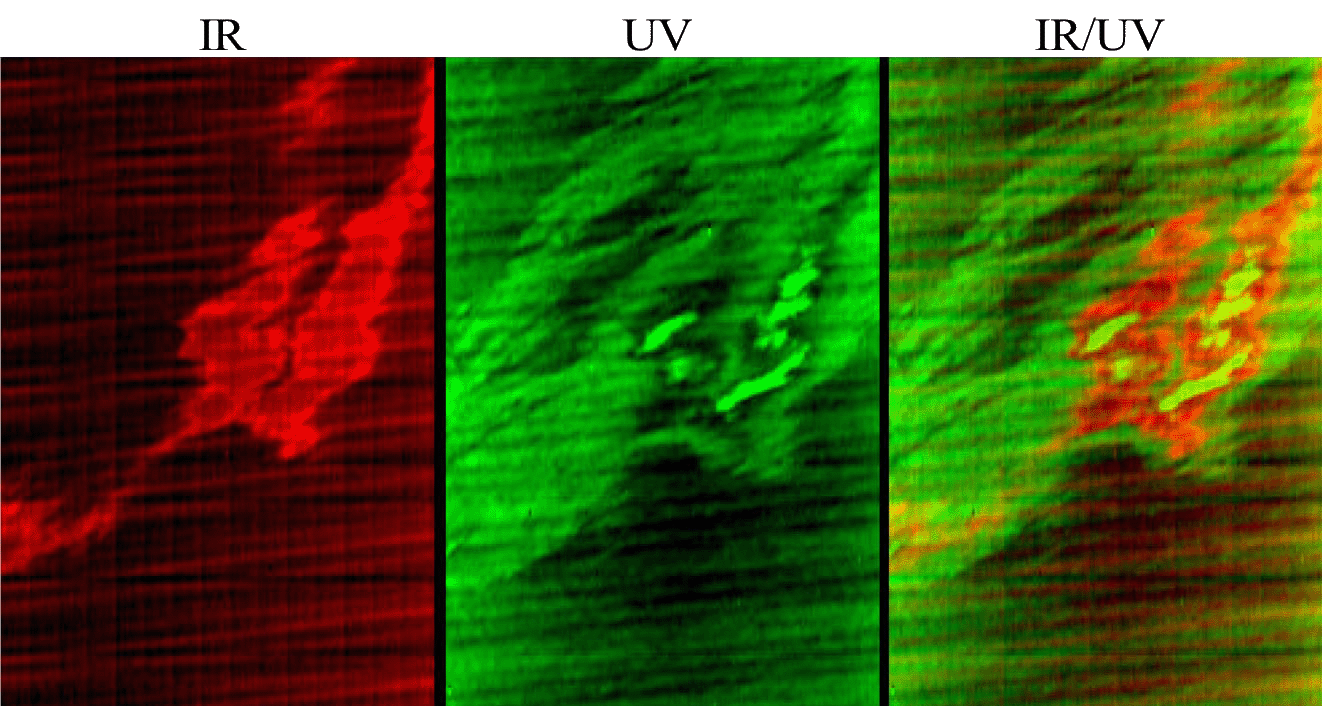 IR, UV and combined artificial image from an oil slick, detected in Spring 2000.
Data fusion requires that the images being combined cover the same area and are virtually identical in spatial resolution. With sensors that are operated independently varying sampling rates, different sensor geometries, swath widths, different data formats and so on makes data fusion time-consuming and difficult to achieve. However, if two sensors are combined, to have common geometries and scan rates, fusion becomes much simpler, with direct one-to-one mapping between two or more images.
