Supplement 2.15: Visual Appearance of Oil on the Water Surface
At times when remote sensing instruments were not yet available for maritime surveillance inspection by sight was the only means for identifying pollutants at sea. In case of deliberate oil discharges, and, even more important, following accidental discharges of large oil volumes, the quantity of oil and its distribution on the water surface was estimated by visual observation.
As mentioned on page 3 of this chapter, a fresh oil spill spreads rapidly out over the water surface. Due to this, thicker parts of an spill disappear within a few hours, thus making clean-up operations with oil combatting vessels very inefficient or even impossible. It is therefore of utmost importance to obtain information on the oil thickness distribution in the shortest possible time.
The colour of water in the presence of oil
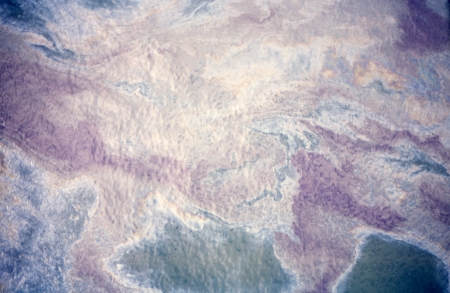
A visual estimation of spill thickness comes from the colour of the oil floating on the water surface. This a not an easy task: even in good daylight conditions an oil spill expert aboard an oil combatting vessel has a very limited line of sight. It is therefore quite difficult to observe the sea surface characteristics at much more than a hundred metres distance. This is much easier when flying above an oil spill and looking downwards, as can be seen in the image below.

In this photograph one can see that oil spreads very inhomogeneously over the water surface. There are areas with a deep brown colour. There are also areas showing a silvery shine, and also a few spots where the sea surface appears almost free of oil.
How can we explain this variety of colours? Heavy fuel used for ship traffic is a deeply brown oil type. We can therefore assume that the dark brown areas in the photograph correspond to the thickest portions of the spill, with a layer thickness in the millimetre to centimetre range. These areas are the source of oil compounds which spread rapidly over the water surface, producing films of a few micrometres thickness.
Daylight is much less absorbed in these thin films than in the thicker layers. Thin films are therefore more or less translucent. At the same time daylight reflection increases. Reflectivity R of a substance is closely connected to its refractive index n, i.e., a higher refractive index gives rise to higher reflectivity. The equation for reflectivity of light shining at vertical incidence on a liquid (water or oil) is:
The refractive index of air is close to 1. For clean water the refractive index is nwater=1.33, and hence Rwater=0.02 or 2% of the incident light is reflected back to the sky. With noil=1.5 for oil it follows Roil=0.04 or 4%. Hence, the reflectivity of oil is two times higher than that of water. This explains the silvery shine of thin oil films when compared with the surrounding oil-free water.
Experienced operators use the following table to estimate oil spill thickness from the colour of the sea surface:
| silver | 0.1 μm (or: 0.0001 mm) |
| rainbow colours | 1 μm (or: 0.001 mm) |
| brown to black | more than 0.1 mm |
Biogenic slicks
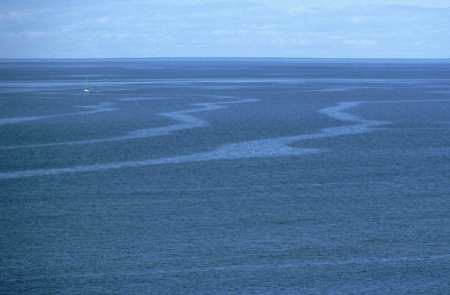
Not all slicks which you can see on the water surface come from mineral oil. Indeed, in calm wind conditions you may find slicks on almost every natural water surface. An example is shown in the photograph below.
These natural slicks are produced by algae which exudate substances that do not dissolve with water. Therefore these substances give rise to surface films which can hardly be distinguished from mineral oil slicks. The layer thickness of natural films is often in the order of one molecule only. Therefore they are named monomolecular slicks!
Despite this tiny film thickness, natural slicks reflect daylight better than the oil-free water, which explains their good visibility.
Related SEOS links
- Worksheet: Visual Appearance of Oil on the Water Surface,
as html page or as printable rtf file - The Side-looking Airborne Radar (SLAR)
- The UV-IR Scanner
- The Microwave Radiometer (MWR)
- The Laser Fluorosensor (LFS)

