Mapping the risks
Which risks do corals face?
Coral reefs are put in a very vulnerable position by different threats. Stressed corals are mostly the result of several threats at the same time.
Largely, four categories of direct threats caused by human activities to coral reefs can be distinguished:
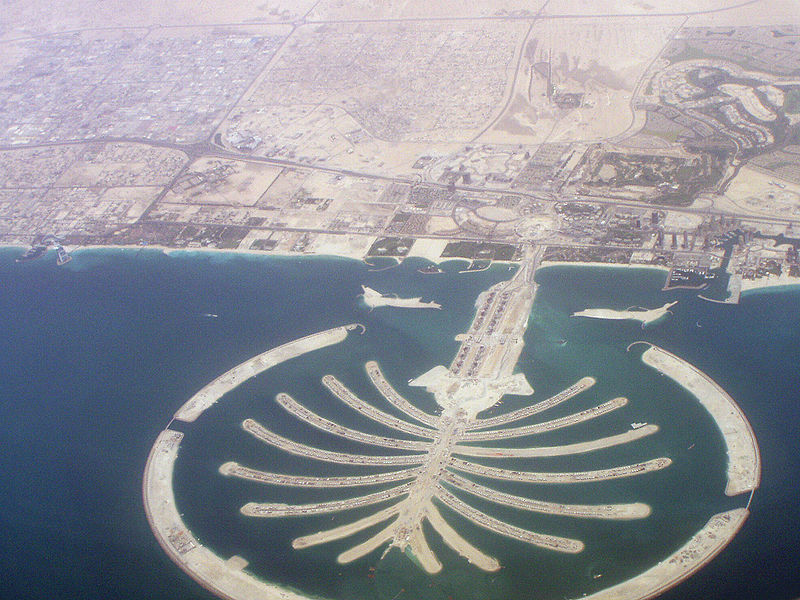
Palm Islands, Dubai.
Source: Helmut Pfau. Coastal development
|

The Argo Merchant ran aground on December 15, 1976. A silvery oil slick can be seen coming from the center holds.
Source: NOAA. Marine pollution
|
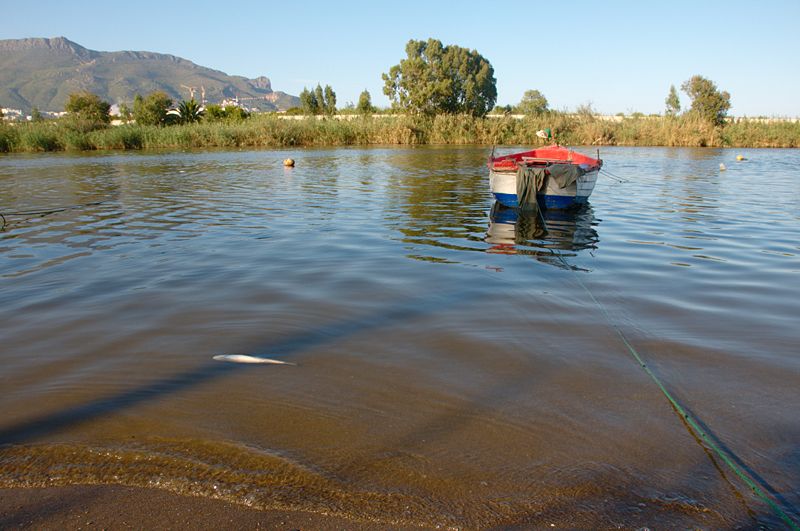
Dead fish on the Soummam River, probably because of pesticides.
Source: Zil. Inland development
|
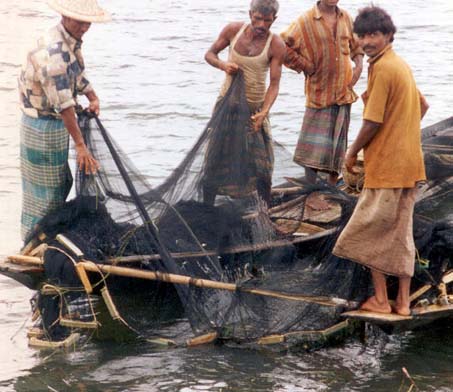
Fishermen in Bangladesh
Source: USAID Bangladesh. Overexploitation and destructive fishing
|
For each threat, the scope of the negative influence can be determined and used to define a 'low risk', 'medium risk' and 'high risk' zone.
Such a map greatly supports decision-making, especially when scientists are putting up a management plan for the protected areas.
When you have read this page, try the 'Mapping the risks' activity.
Example of the region of Hurghada (Egypt)
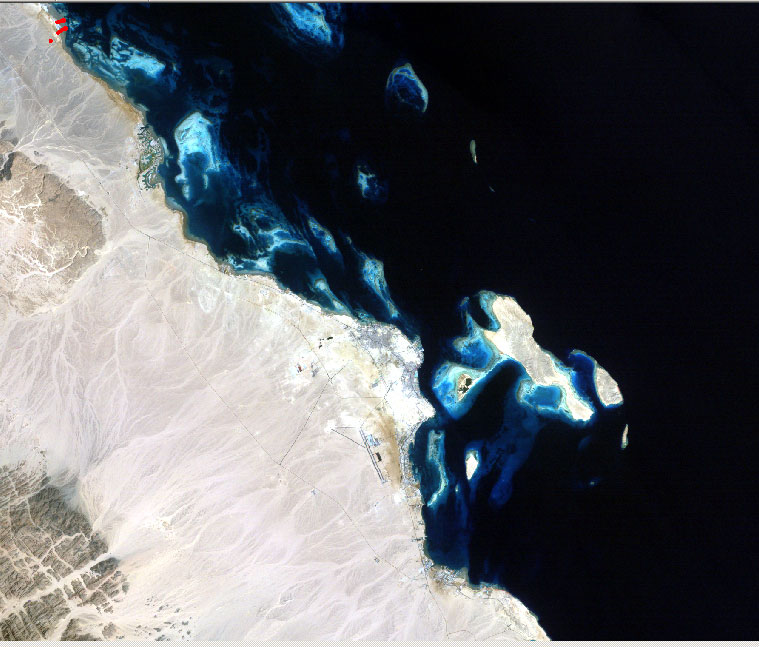
Source: Vanderstraeten, 2007.
In the NW of the studied area, two oil-drilling platforms are located. The chance that corals are in stress due to an oil leak is biggest close to the platforms. The further you go away from the drilling platforms, the smaller the risk that corals get stressed.
This information can be mapped out in a risk assessment map. This map contains the different zones: a high risk zone (red in the image) close to the platforms passes into a medium risk zone (orange) that is located further away. The risk that corals get stressed due to oil leaks is lowest in the green zone.

Source: Vanderstraeten, 2007.
This is the reproduction of the potential level of stress to coral reefs due to the presence of oil-drilling platforms in the vicinity. Of course, this can be extended to other sources of threats.
