1. Introduction to Categorisation of Objects from their Data
Let's have a look at a satellite image
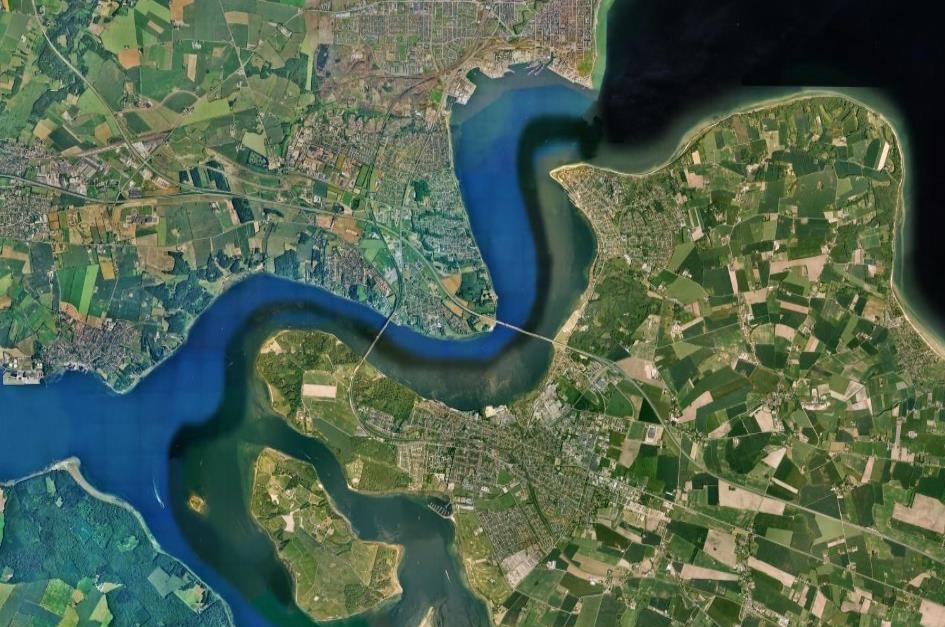
Source: Google Earth
This is much better, don't you think? You can now see lots of green vegetated and greyish brown urban areas and it is fairly easy to distinguish them. However, a proper land utilisation plan needs even more detail. What can you do?
Let's play with the colours of the satellite image.
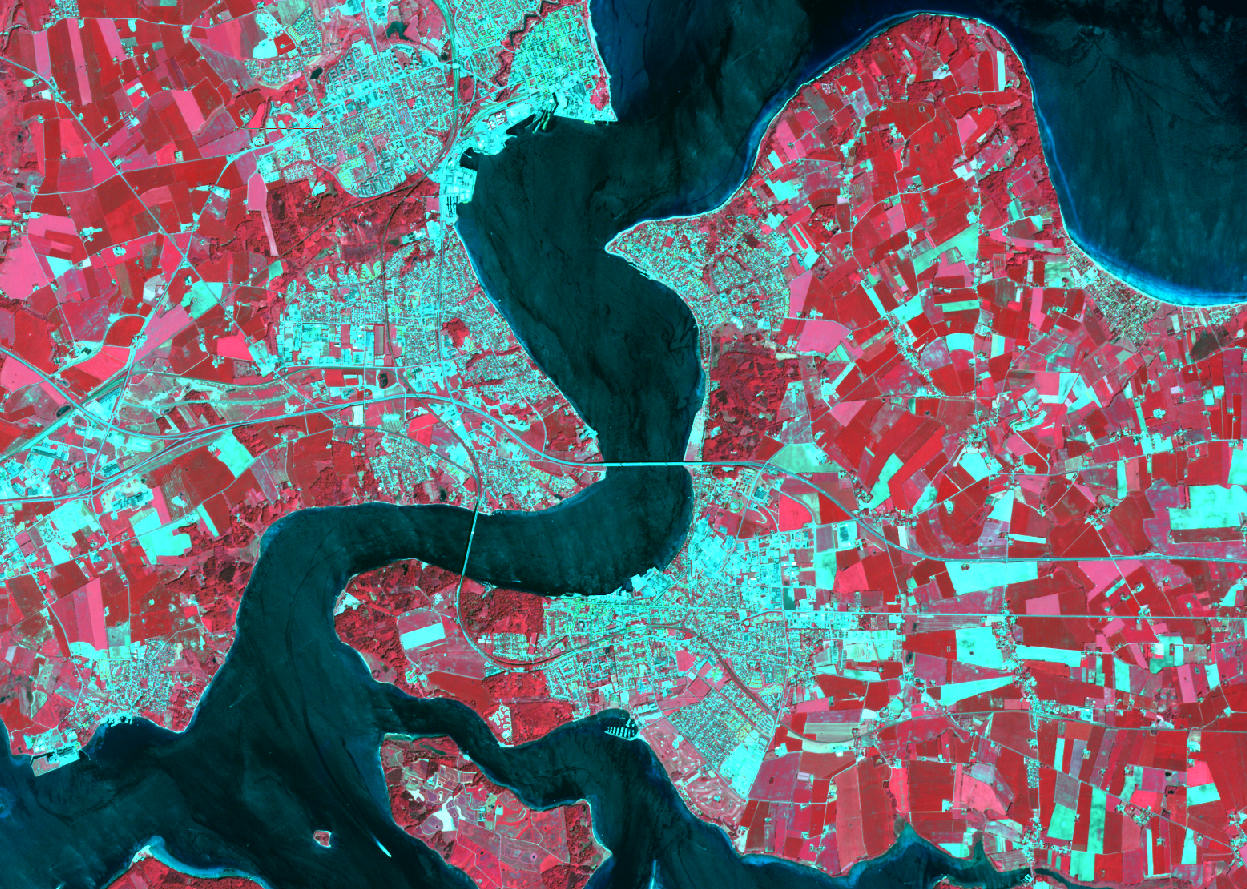
Image source: USGS
If you zoom into the image you can see many different small areas not covered with buildings and streets that could not be seen on the maps or the satellite image with natural (true) colours.
In this image, green vegetation appears as bright red, bare earth and urban or built up areas as cyan and water as very dark blue. There are different shades of red and blue and different structures can be detected.
You can now distinguish different kinds of landuse fairly easy!
How much vegetation is there in the two cities?
Your next step will have to be to find out about the percentage of urban land and vegetated areas in the two cities.
You could print the false colour image, put a sheet of overhead transparency over it, draw along the lines of the fields, forests etc., measure the outline of your urban and vegetated land, calculate their area and count them together.
Sounds a bit long-winded? This is how it was done before we had computers to help us! Today, the measuring and counting can be done by your PC. All you need is a software that can 'read' the image: it needs to distinguish the different colours in the image and calculate the size of the different areas.
Finding similar objects (1/2)
If you want to analyse different land surfaces from a satellite image, you need to know what kind of information has been detected by the satellite sensor and how to interpret this data. The second step then is to group all the information you have gathered about one type of land cover into one class. For example if you want to distinguish water, soil and vegetation you need 3 classes with equal or similar information.
There are two ways of analysing a satellite image:
- Image interpretation with the human eye ("Human Vision") and
- Digital analysis with the computer ("Computer Vision").
Who can do it better?
With our eyes we can perceive structures, forms, textures and objects in an image. With our pre-existing knowledge we can interpret these features. However, when it comes to details such as different shades of grey the ability of human vision has soon reached its limit. In addition, the spectral (color) range of human visibility is only a fraction of the radiation detected by satellite sensors.
With computers it's the other way around: they are able to detect very detailed information about, for example, grey scales. They can easily calculate the size of specific areas. With a computer, the full spectral range of electromagnetic waves can be analysed. But the analysis of textures or structures in an image will always have to be aided by human vision and perception.
