1. Introduction to Categorisation of Objects from their Data
The first step is to have a look on the map of both cities.
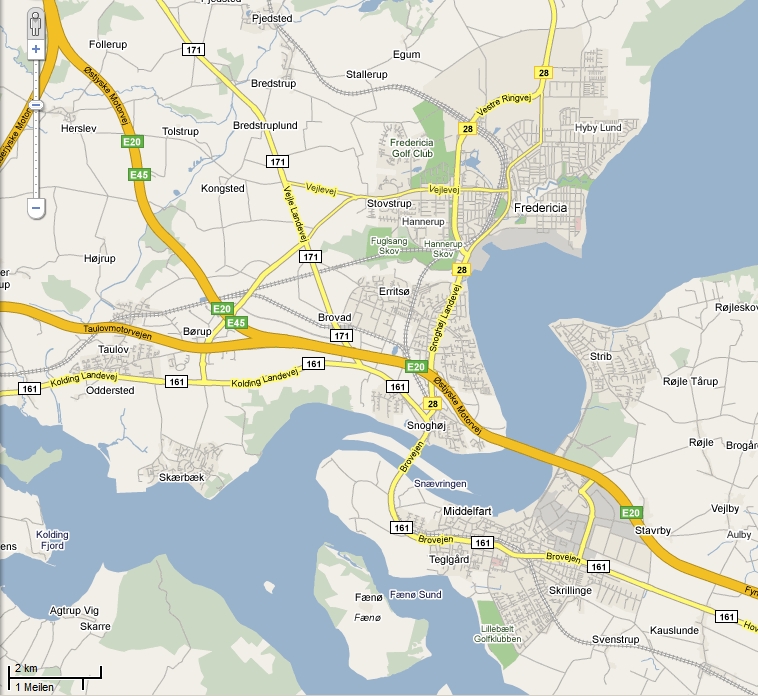
Map of the cities of Fredericia and Middelfart, Denmark.
Source: Google Maps
Source: Google Maps
You can basically distinguish four different colours, i.e. grey, green, yellow and blue, representing urban areas, vegetation, roads and water respectively.
Have a look at a map with a larger scale:
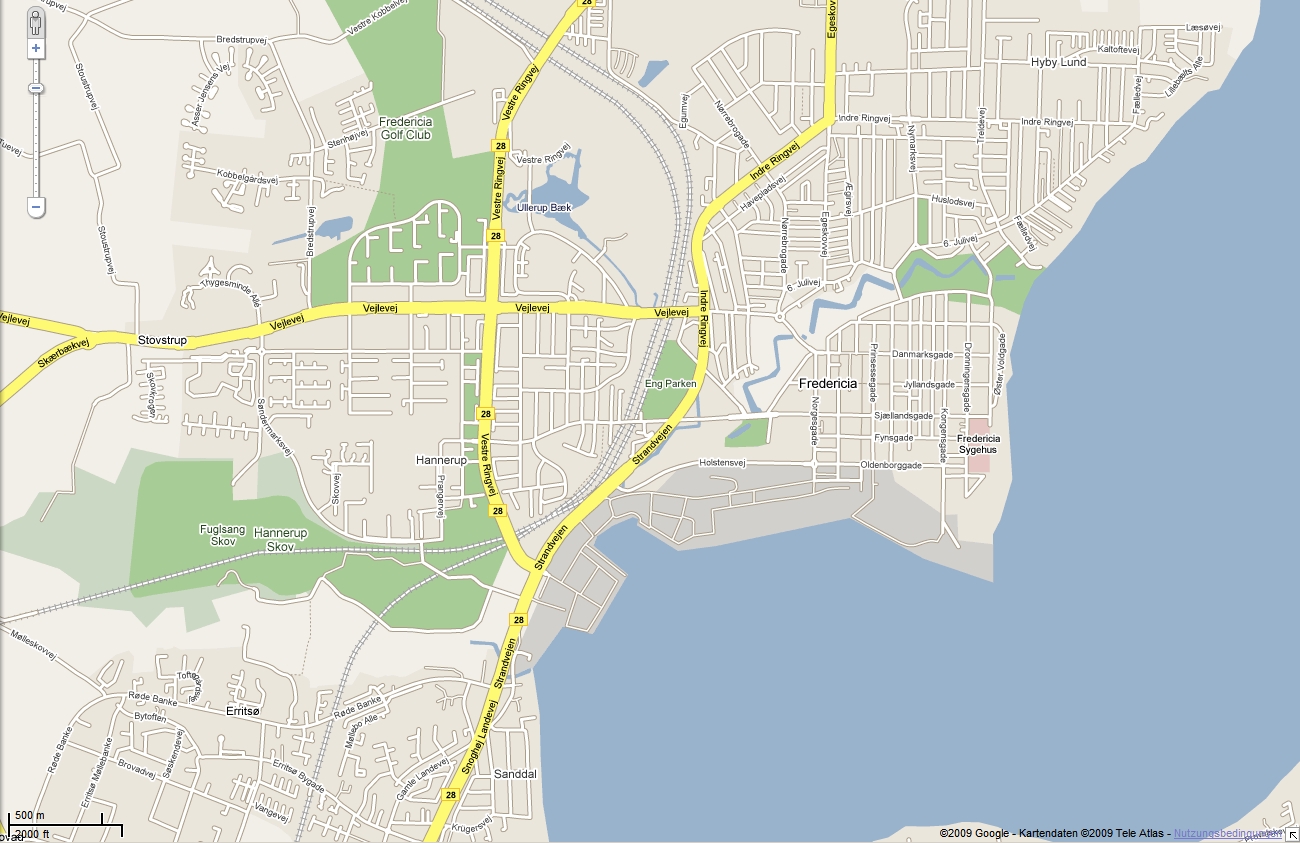
Map of Fredericia, Denmark.
Source: Google Maps
Source: Google Maps
At this scale it is easier to distinguish urban areas from vegetated areas, but this is not accurate enough for town planning.
