1. Introduction to Categorisation of Objects from their Data
The basic concept
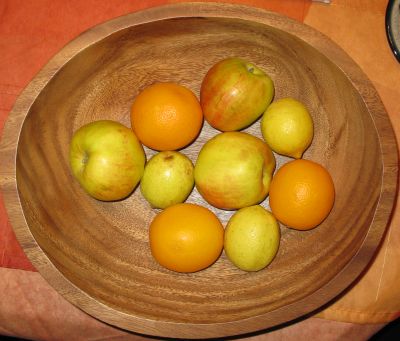
You have a supply line of oranges, lemons and apples, and you want to separate them on the basis of their colour. How can you do this?
Or you may have a satellite image of an area and you want to find the town areas on this image. How can you do this?
Both of these activities involve categorizing objects from data about those objects. This activity is called classification. In this module you are going to learn how to do this. But first, we need to understand data; how we can describe data in simple ways and then how we use this data to classify the objects based on this data.
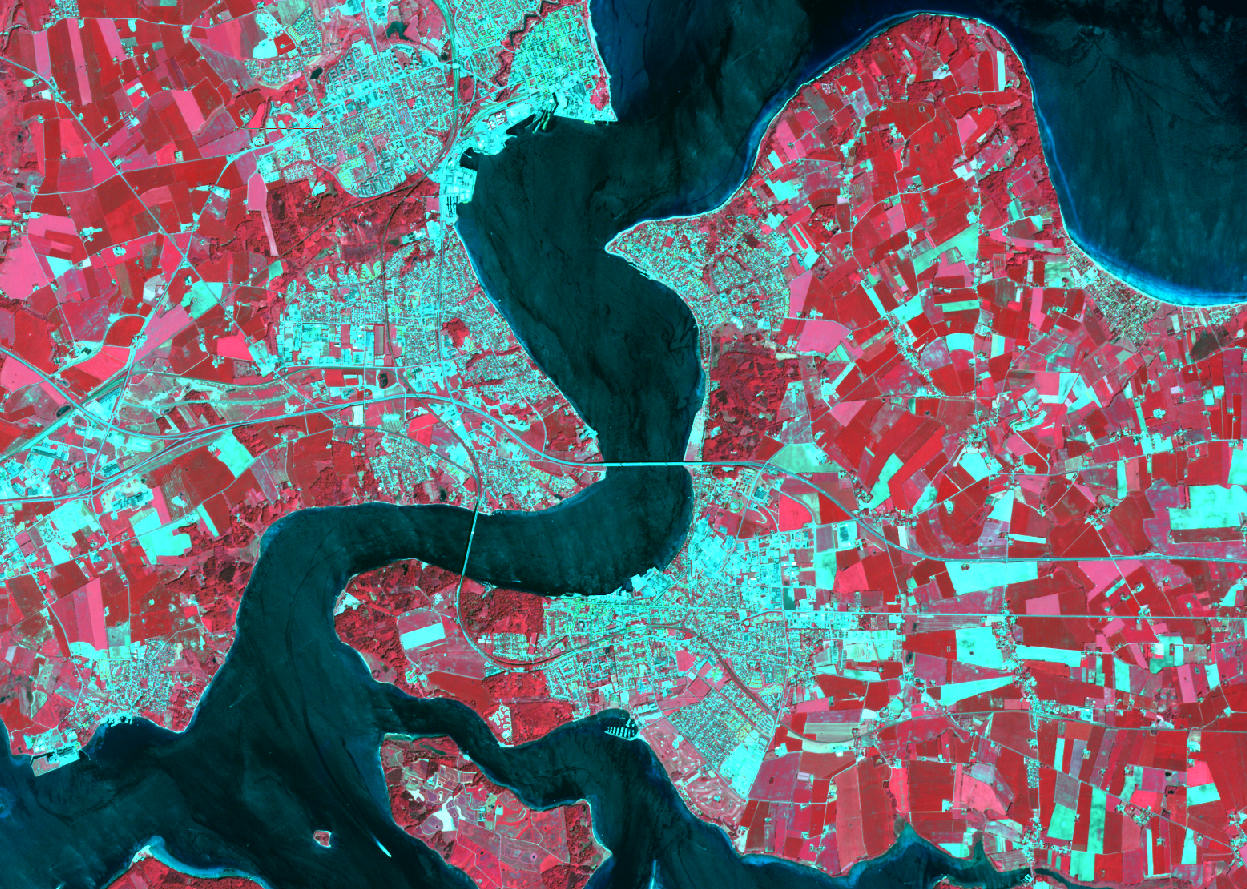
Image source: USGS
Imagine the following scenario:
You are a town planner in Denmark. The city governments of Fredericia and Middelfart would like to develop a common land utilisation plan. In this plan, new areas for urban development will be pointed out whereas other areas shall be designated as nature reserves. How can you find out which areas are covered by vegetation and which areas are covered with buidlings and roads?
