Supplement 5.3: Satellite Measurements of Sea Ice (1/4)
Different wavelengths, different views
Satellite sensors operating in different parts of the electromagnetic spectrum can provide different types of information about sea ice.
Visible, infrared, passive microwave and radar (active microwave) instruments can all tell us something about sea ice for all or part of the year.
How do the different sensors ‘see’ ice?
What are the advantages and disadvantages of the different techniques?
The visible spectrum
Sensors operating in the visible spectrum (400 - 750 nanometres) detect sunlight reflected by sea ice.
Sea ice reflects 50 to 70 percent of the incoming energy and ice covered with snow reflects even more, about 90 percent. This compares to about 6 percent reflection for open water.
Smooth, flat ice will behave much like a mirror, whilst a rougher surface will scatter light in many directions.
Visible sensors can give us information on:
- The area covered by ice (ice looks different to the surrounding water)
- the type of ice (sometimes)
Some of the sensors
Visible sensors are regularly used for monitoring ice cover and generally have spatial resolution of a few hundred metres to one kilometre, and can view a few hundred to 2000 km of the surface at a time for example:
- MERIS on the ENVISAT satellite
- the MODIS sensors on the NASA Aqua and Terra satellites
- AVHRR on the NIMBUS series of satellites
Visible sensors with higher resolution (for example ASTER on the Terra satellite, which has a resolution of 15 m) can give much more detail, but do not have the coverage needed for monitoring ice extent.
Visible sensors give daily or better coverage of the Arctic, but require daylight and cloud-free conditions to provide useful images of the surface.
Infrared
Sensors operating in the infrared part of the spectrum detect radiation emitted by the surface at wavelengths typically in the range 10 - 12 μm (thermal bands), and at shorter wavelengths (1.6 μm), sunlight reflected by the surface.
Sea ice is highly reflective both in the visible and the near infrared.
Infrared sensors can give us information on
- the area covered by ice (ice looks different to the surrounding water)
- the type of ice (sometimes)
Infrared sensors
Infrared sensors regularly used for monitoring ice cover generally have spatial resolution of one to a few kilometres, and view a few hundred to 2000 kilometres at a time, for example
- AVHRR on the NOAA series of satellites. There are usually at least two satellites in orbit carrying AVHRR sensors. NOAA-19, launched in February 2009, and Metop, launched in October 2006, both carry the latest version: AVHRR/3.
- AATSR on the ENVISAT satellite, and its predecessor ATSR on the ERS satellites
- the MODIS sensors on the NASA Aqua and Terra satellites
The Landsat series of sensors has a thermal band with a resolution of 80 metres and can give much more detail.
Infrared sensors give daily or better coverage of the Arctic, but require cloud-free conditions to provide useful images of the surface. The thermal bands can operate at night as well as during daylight hours.
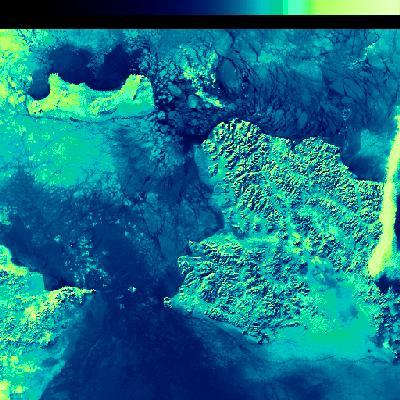
Infrared images (right and below right)
These images are examples of infrared data at different wavelengths. The 1.6 μm ATSR image is of the Bering Strait area, whilst the thermal AATSR image is of Foxe Basin, Canada. Both instruments and bands have a spatial resolution of one kilometre.
Another visible image from MODIS is shown below left. It is a colour composite image of Northern Greenland, made up from three blue wavelengths (411.3 nm, 442.0 nm and 486.9 nm) .
RGB false color reflectance composite, 1km resolution, of the Northern Greenland Arctic area using MODIS bands 8, 9, 10, 03 April 2001.
Source: MODIS Snow/Ice Global Mapping Project
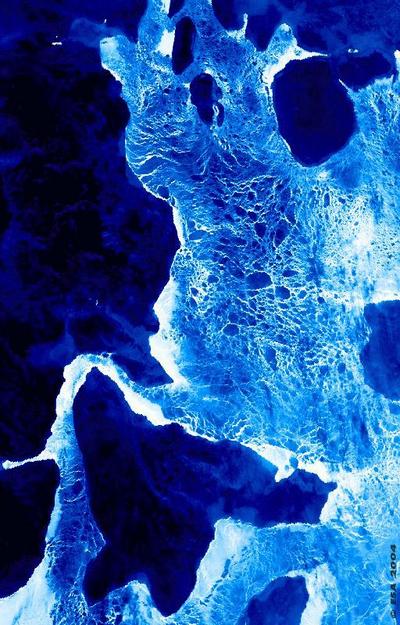
The pack ice is whitish-blue in colour while the snow-covered land appears deep blue or black in colour.
Source: ESA
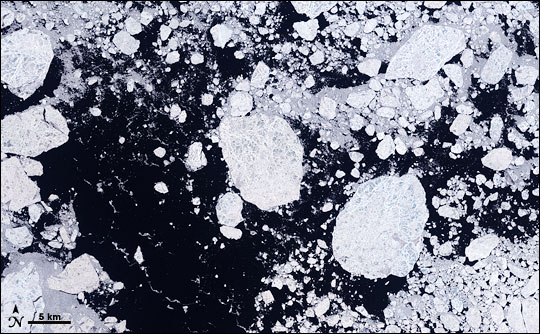
Foxe Basin
Located north of Hudson Bay between the Melville Peninsula and the large Baffin Island, Foxe Basin remains ice-covered for most of the year, with landfast ice dominating in the north and pack ice covering the deeper southern waters. Foxe Basin is rarely ice free until September, with open pack ice common throughout the summer.
This is one of the most biologically rich and diverse areas of the Canadian Arctic. The many polynyas of northern Foxe Basin support colonies of bearded seals and the largest walrus herd in Canada. Ringed seals are polar bears are common, and it is also a summering area for bowhead, beluga and narwhal whales.
Visible images
The images below are examples of data from visible sensors at different spatial resolutions. The higher spatial resolution data (from Aster, Landsat) only cover a small area at a time, but give a detailed picture of the ice cover. The Multi-angle Imaging SpectroRadiometer (MISR) image has a pixel size of 275 metres. The mosaic of MODIS images (see chapter 5) covers the Arctic over two days in September 2007.
Source: NASA Earth Observatory

Source: NASA Earth Observatory

Source: Jet Propulsion Laboratory, USA.
Near infrared (1.6 μm) daytime image of the Bering Strait on 5th February 1992 from ATSR. The area covered is 512 km x 512 km. In the colour representation, the brightest areas are the most highly reflecting.
Source: ESA
Bering Strait
The sea in this ATSR 1.6 μm image (above) is packed with ice floes. The image brightness depends on the reflectance of the surface. Yellow is very bright (cloud) and dark-blue black the poorly relecting sea water.
In the cracks and gaps between the ice, the much less-reflective water surface appears almost black. The brightest area is the finger of cloud on the western side of the image. Also brighter than the icy sea are the three land areas in the picture.
Lasers from space
ICESat
ICESat (Ice, Cloud, and Land Elevation Satellite) measures ice sheet mass balance, cloud and aerosol heights, as well as land topography and vegetation characteristics.
GLAS (the Geoscience Laser Altimeter System) on ICESat is the first laser-ranging (lidar) instrument for continuous global observations of Earth. The laser transmits short pulses (4 nanoseconds) of infrared light (1064 nanometres wavelength) and visible green light (532 nanometres).
The time taken for the laser pulse to return to the sensor can be used to calculate surface height, and the intensity of the return pulse is related to the type of surface, for example ice or water.
ICESat measures the distances to the top of the snow cover and to the sea surface. The difference between the two quantities gives the total ‘freeboard’ measurement; that is, the amount of ice above the water line relative to the local sea level. Scientists can then relate this measurement to ice thickness.
NASA scientists have used ICESat data to show that Arctic sea ice thinned dramatically between the winters of 2004 and 2008, with thin seasonal ice replacing thick older ice as the dominant type for the first time on record.
See Supplement 5.3 Page 4 for more on ICESat and Arctic ice thinning.
Learn about using microwave sensors for sea ice studies on the next page.
