Download the Worksheet 'Visual interpretation of Satellite Images' for use in class. Find here the HTML version of the worksheet.
Objectives:
A true colour satellite image is a combination of different bands of the visible light spectrum
resulting in an apparently natural image, similar to what an airplane passenger would see when looking down from a plane.
The satellite image mosaic (a mosaic is an adapted composition of various satellite images)
in the worksheet depicts Europe and was recorded by the vegetation sensor onboard SPOT satellite in 2002.
Didactical comment:
- The worksheet 'Visible Interpretation of Satellite Images' will teach the students how to read and interpret a true colour satellite image. The image mosaic of Europe should be described and the different colours should be assigned to various land cover types.
- Students are supposed to analyse during which season of the year the images were recorded.
- At the end, the results should be documented on transparencies.
Solution to the worksheet 'Visual Interpretation of Satellite Images'
-
Describe the satellite image mosaic of Europe. What different patterns and surface structures (regional landscapes) can you identify? You may use additional references such as topographic, geological, soil, or regional planning maps.
- Refer to an ESA school atlas, page 52/53 or every other school atlas with a topographic map of Europe to verify your results.
- The main colours in the image (green, yellow, brown) represent changes in land cover.
How are they linked with land cover types like forests, pastures etc. and where can you identify
large settlement areas?
Image colours/patterns Land cover types Black and dark blue areas Water bodies, ocean White areas Snow cover, glaciers Red areas Urban areas Light green areas Pasture and agricultural land Medium and dark green areas Deciduous and coniferous forests Red to brown areas Rocks and mountain areas without vegetation Brown to yellow areas Vegetation free areas, deserts Turquoise areas Salt lakes (in Tunisia, Algeria and Turkey) - A mosaic is composed of a number of images taken from various satellites. In which season (spring, summer, fall, winter) do you think the images were taken? Explain your decision.
- The images were taken between July and September 2002.
- The missing snow cover over land and only some small snow covered areas in the Alps, Norway and in Iceland (glaciers) speak for summer.
- Large areas over Europe and North Africa are very green due to rich vegetation, especially in Northern Europe.
- Take a transparency film and cover the image with it; use paper clips to secure the transparency.
Label distinctive points and trace the coastline.
a. Draw the country borders of the European countries with the help of an atlas. Discuss in class why some boundaries follow natural surface features and others do not.
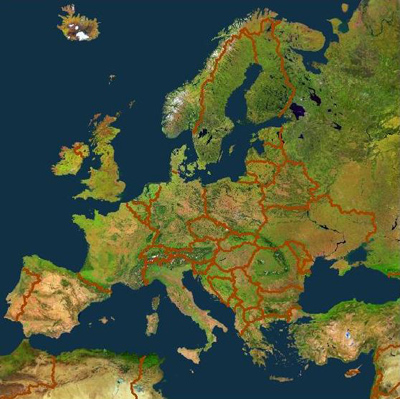 Satellite image mosaic of Europe, viewed by SPOT Vegetation in 2002.
Source: Beckel 2007b. Delineate important regional landscapes and label them with the help of an atlas.
- Refer to an ESA school atlas, page 52/53 or every other school atlas with a topographic map of Europe to verify your results.
Download the Worksheet 'Visual interpretation of Satellite Images' for use in class. Find here the HTML version of the worksheet.
