


1. Match the Climate to the Location!

1 2 3 4 5 6 7 8 9 10 |
1 2 3 4 5 6 7 8 9 10 |
1 2 3 4 5 6 7 8 9 10 |
1 2 3 4 5 6 7 8 9 10 |
1 2 3 4 5 6 7 8 9 10 |
1 2 3 4 5 6 7 8 9 10 |
1 2 3 4 5 6 7 8 9 10 |
1 2 3 4 5 6 7 8 9 10 |
1 2 3 4 5 6 7 8 9 10 |
1 2 3 4 5 6 7 8 9 10 |
Chapters 2 and 3 may help you tackle this quiz
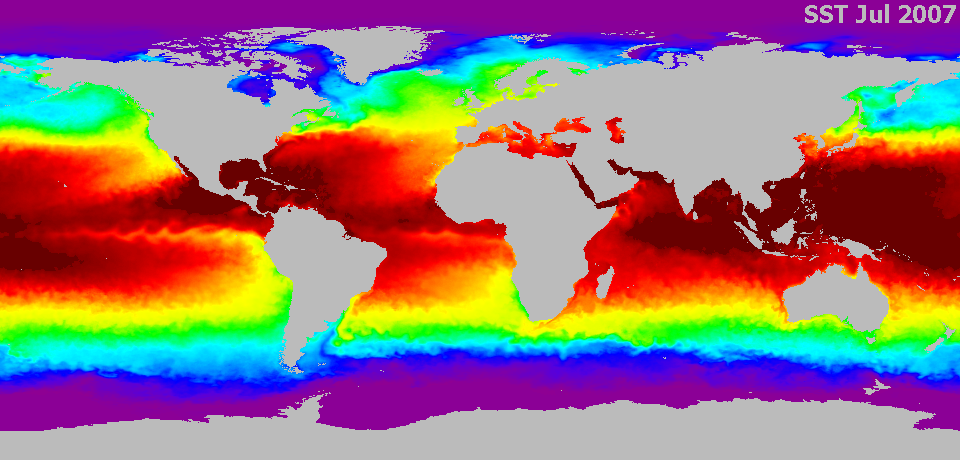
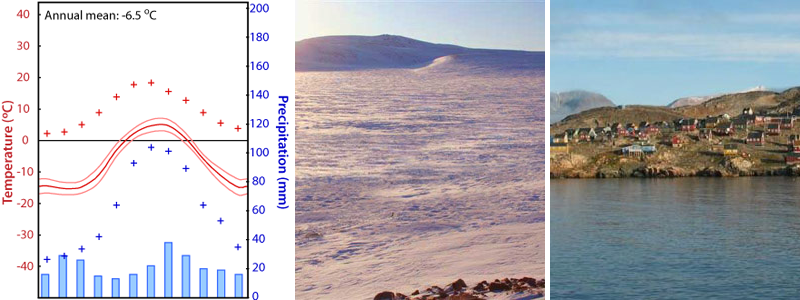
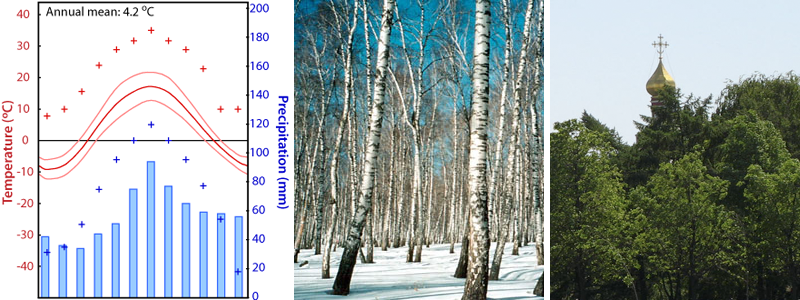
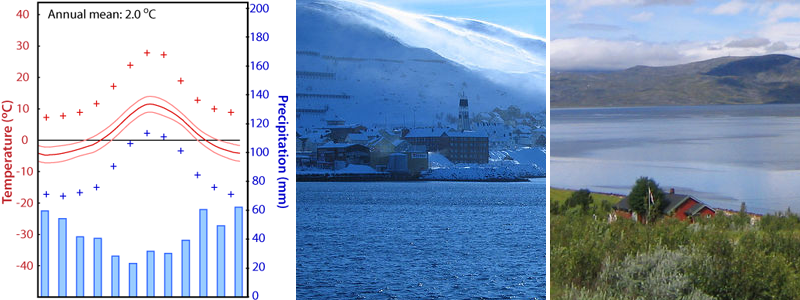
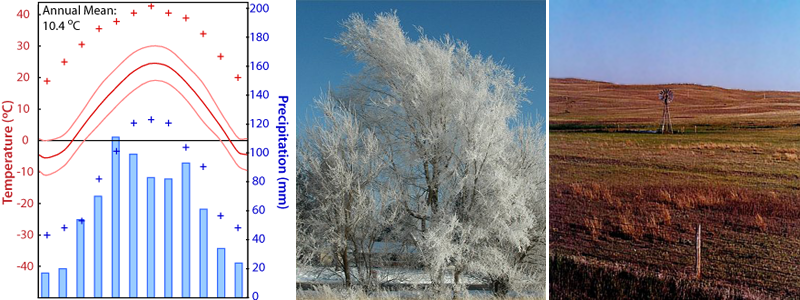
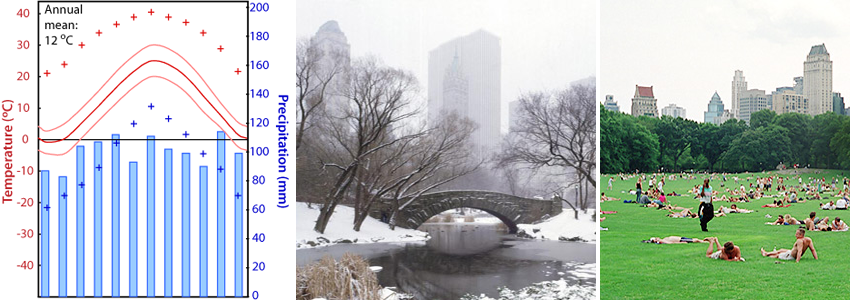
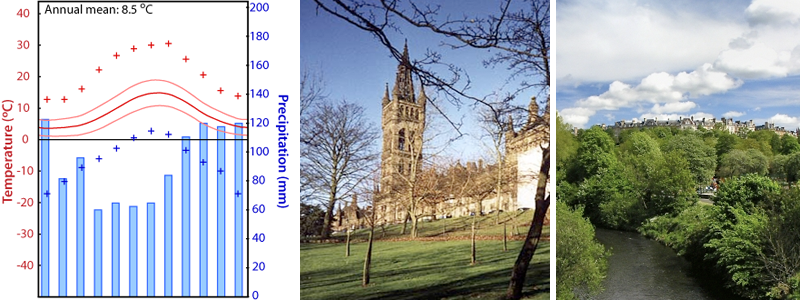
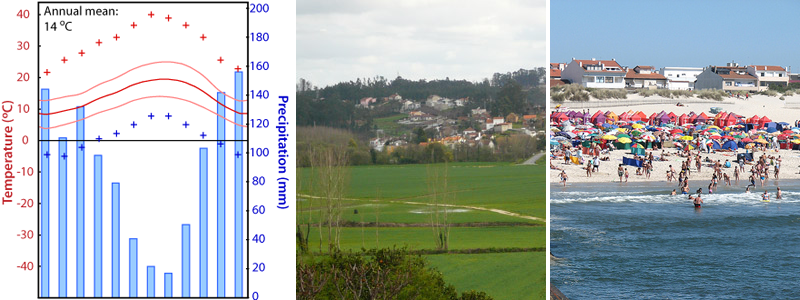
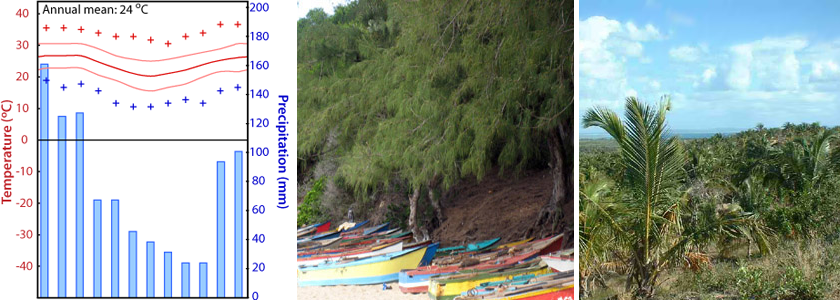
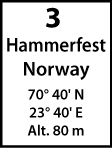
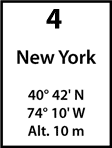
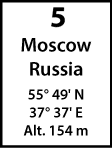
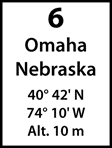
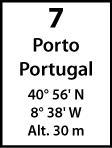
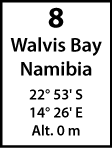
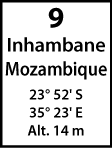
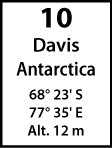
The climate of any location is characterised by averages in temperature and precipitation based on measurements over several years. The averages are controlled by latitude, prevailing winds, distance from the sea, altitude and aspect.
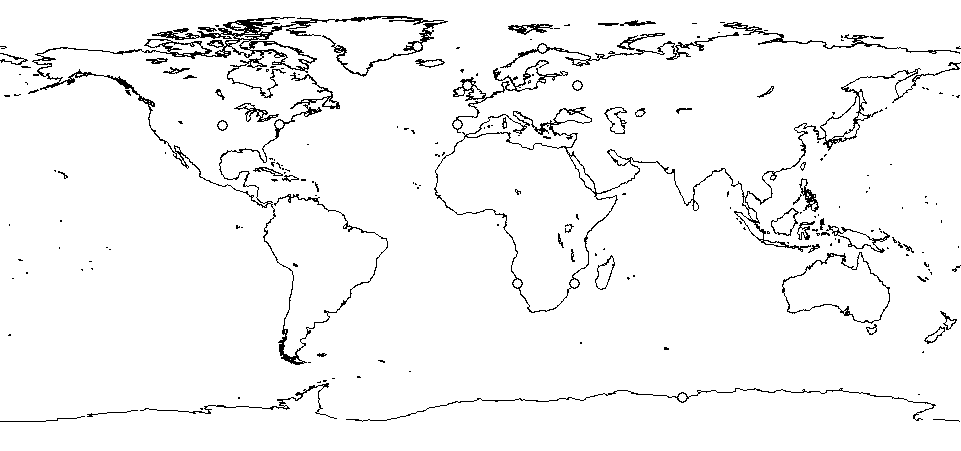
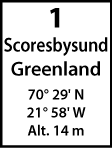
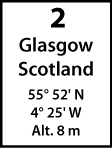
Above are climate statistics from 10 different locations, labelled from A to J. Match these to the locations on the map by selecting the correct number from the list underneath each image. Maximum score is 200 for 10 correct entries in one go.
Each time you make a mistake the score for the following correct answers are reduced by 1 point. After 20 attempts, no more points are given for correct entries, but you can of course continue without scoring until you have placed all the charts against the right location.
