2. Oil Pollution
Remote Sensing as a Management Tool in Oil Spill Control
Remote sensing is now an important management tool for the monitoring of oil pollution. Data from satellites and aircraft are used in different ways:
- to provide information for the planning of oil spill cleanup after major accidents,
- to monitor and control illegal discharges of oil from platforms, pipelines and ships,
- and in environmental impact assessments after accidents or to study the effects of chronic pollution associated with shipping lanes, ports, oil platforms, pipelines and refineries.
Remote sensing support for oil spill response
When a major accident occurs, the oil spill response team must evaluate the situation and decide on suitable techniques to limit oil spread, clean-up affected areas and protect valuable environment and resources. They have to consider both the spill itself and the environment in which it occurs.
Planning of spill response will include:
- Obtaining information about the spill itself: location, oil type, oil volume, rate of leakage and what can be done to reduce or stop it.
- Surveillance to map the spill and provide information needed to direct the clean-up.
- Oil spill trajectory modelling to predict where the oil will move next.
- Identifying vulnerable areas and resources that need special protection: valuable natural environments and wildlife reserves, public amenities (beaches, leisure parks and harbours), industries and infrastructure (power stations, aquaculture sites).
- Selecting the most appropriate equipment and methods for combating the spill, protecting vulnerable areas and cleaning those that have already been affected.
Remote sensing can provide information to help with these planning tasks, and is invaluable for mapping the spill and providing input into oil spill models.
Surveillance to map the spill and direct the response
Choosing appropriate techniques and applying them effectively requires information.
- Short-term (1-2 hours) tactical information is needed to direct oil spill countermeasures.
- Longer term (~12 hours) strategic overviews of the whole spill are needed to map the spill, show how it evolves, and for use with oil spill trajectory models.
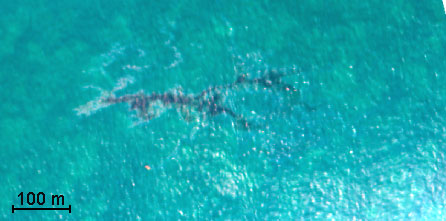
Oil spills are dynamic in nature, so information used to direct counter- measures must be available in real-time. Information needed includes position, extent and thickness of surface oil, at resolutions of only a few metres. Traditionally airborne sensors are used for this. Thermal infrared, optical and ultra-violet sensors, laser fluoro-sensors and airborne radars can detect surface oil and provide estimates of thickness, especially when used in synergy.
For an overview of the whole spill satellite images are needed. Satellite data are now available in near-real-time (~12 hours) from sensors with sufficient spatial resolution, a wide field of view and orbit repeats that make them a useful complement to the airborne sensors. Synthetic aperture radars (SAR) can detect surface oil over a large area, and can see through cloud. Interpretation of SAR data can be improved by including information from other sensors.
To give an overview data from many different sources can be combined in a GIS system such as this one. In this case, this only happened after the event during the post-spill assessment, as much of the data was not available in time. Today this information can be available in time to make a real difference.
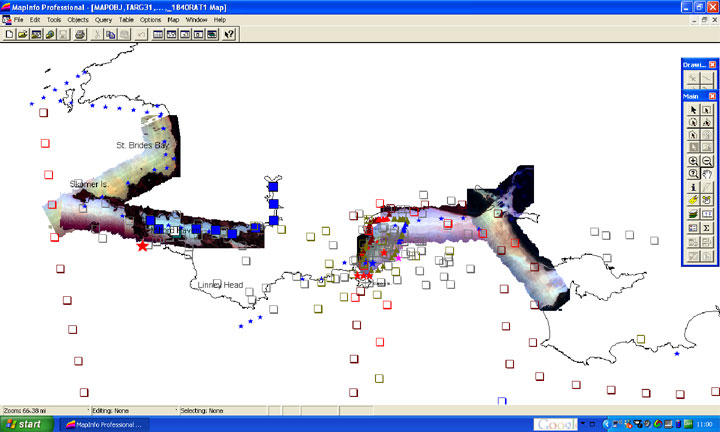
Source: UK Environment Agency / S.Boxall, National Oceanography Center, UK
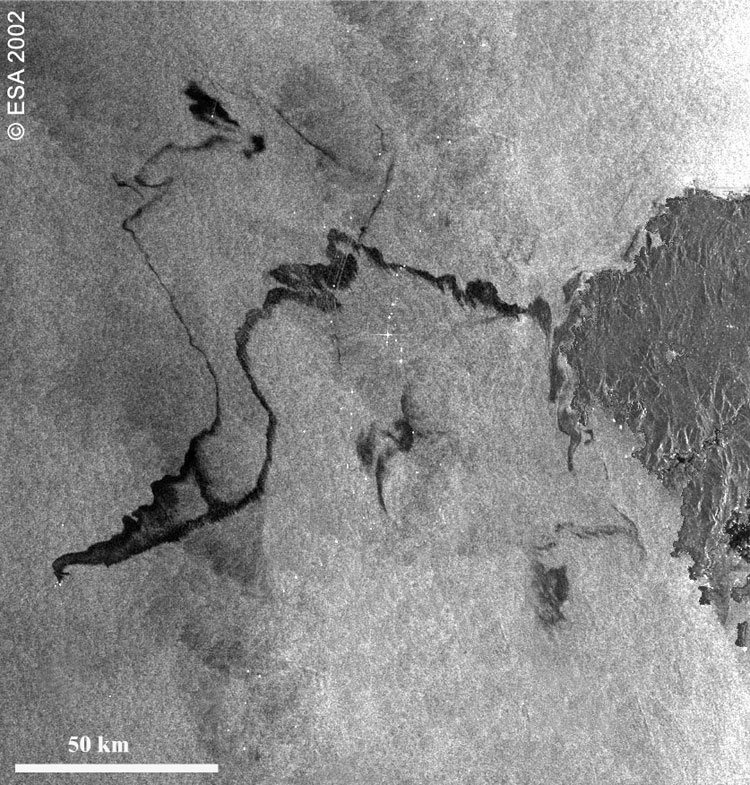
Monitoring the accident in the Kerch Strait, November 2007
The Kerch Strait oil spill below provides an example of how satellite derived information can be used with oil spill models to map and predict the movement of oil.
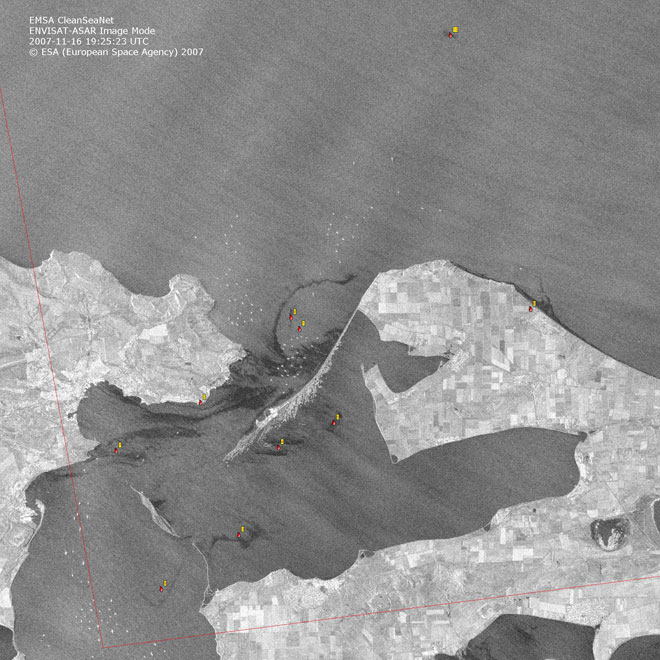
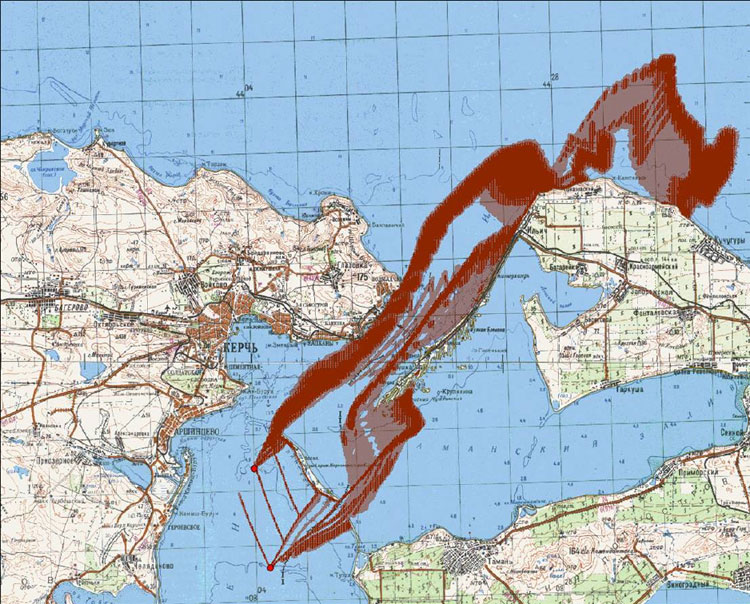
This image from the ASAR instrument onboard ESA's Envisat shows oil from the tanker accident in Kerch Strait between the Black Sea and the Azov Sea. The image was obtained on the 16th November 2007, nearly 5 days after the accident. A number of other ships have also released oil in the area. Surface oil appears as dark streaks. Bright blobs are ships.
The Kerch Strait spill was modellied by SPILLMOD hydrodynamic model to show where the fuel oil from the damaged ship was likely to be transported by wind and waves.
Environmental data for input to oil spill models
It is not enough to know where the oil was two hours ago, or even where it is at this moment. Being able to tell where the oil is headed, is essential both for clean-up and for protecting vulnerable environments and resources.
Oil spill models need information about:
- Wind speed and direction
- Wave height and the direction of swell waves
- Speed and direction of local currents and how these vary with tides, river-flow etc.
- Sea and air temperatures
This information is obtained from local weather reports, tide tables etc., with extra information available from a variety of satellite measurements.
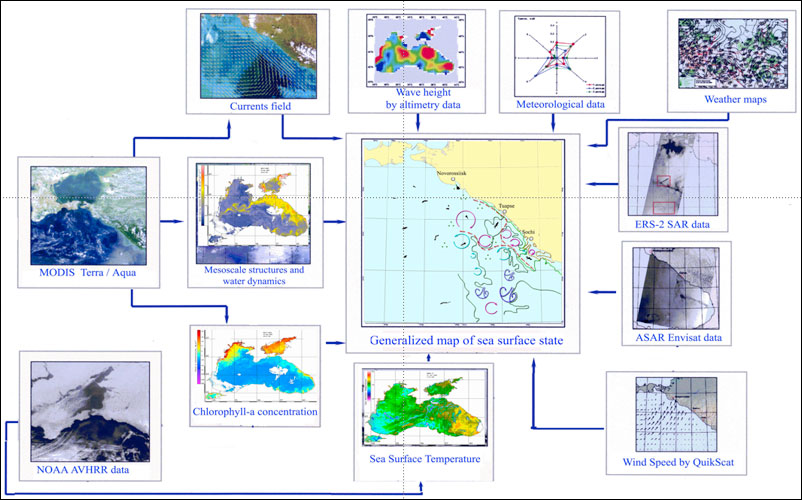 Using a range of different sensors to obtain environmental information.
