7. Water Analysis Using Lidar
Measurement of natural properties of water (1/3)
As explained previously, substances that occur naturally in bodies of water emit fluorescence signals and can therefore be measured with a fluorescence Lidar.
The graph below illustrates the emission spectrum of a sea water sample and the absorption spectrum of purified water. The absorption spectrum demostrates the so-called blue-green window of water: absorbance in the near ultraviolet (350-400 nm) and at blue and green wavelengths is low, hence pure water is very transparent (dissolved salts present in sea water have a very minimal effect on the transparency).
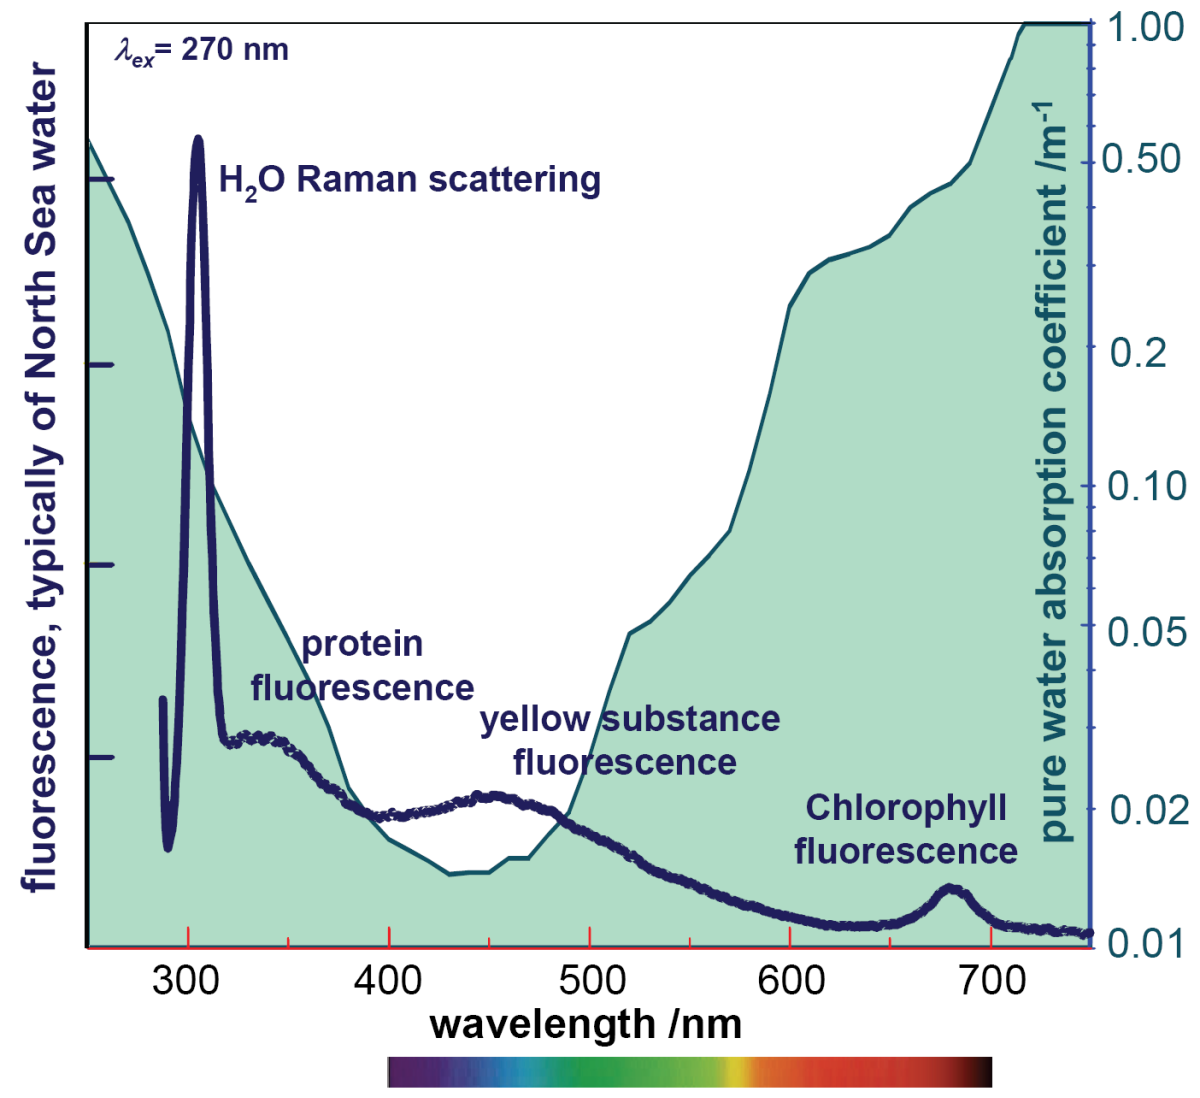
Comparing the two curves, we see that fluorescence of yellow substances or Gelbstoff can also be measured in great depths, whereas fluorescence of proteins and chlorophyll can only be measured in depths close to the surface.
The fluorescent bands occuring in the emission spectrum reflect the concentration of substances that are typical in the waters of the North Sea:
- The protein signal is caused by fluorescent compounds of proteins, particularly the amino acid Tryptophan. This type of protein is present in phytoplankton (or algae), in bacteria and higher level organisms.
- The gelbstoff signal is caused by water soluble humic substances; in oceanography, they are also referred to as yellow substances because of their yellow colour, or as CDOM - Chromophoric Dissolved Organic Matter. Humic substances are produced by degrading plant matter on land that have been washed by rivers into the ocean, as well as by dead or degrading algae in the sea. The concentration of humic substances in sea water is approximately 1 to 10 milligrams per litre.
- The chlorophyll signal is emitted by the green pigment present in pythoplankton called Chlorophyll a which absorbs light for photosynthesis. A small portion of the absorbed light is re-emitted as fluoresence. More about photosynthesis is explained in the SEOS Tutorial Remote Sensing in Agriculture.
The image below shows the results of measurements taken from an aircraft flying over the Canary Islands region. Along the marked flight tracks, the emission of yellow substances was measured using a laser fluorosensor. A geostatic method called Kriging was used to extrapolate the data and to convert them into a map with colour codes. Colours corresponding to the colour bar indicate the values of the measured signals. The colour brightness indicates the quality of statistical estimates: the further away from the flight tracks, the lighter the colour, means increased inaccuracy of the estimates.
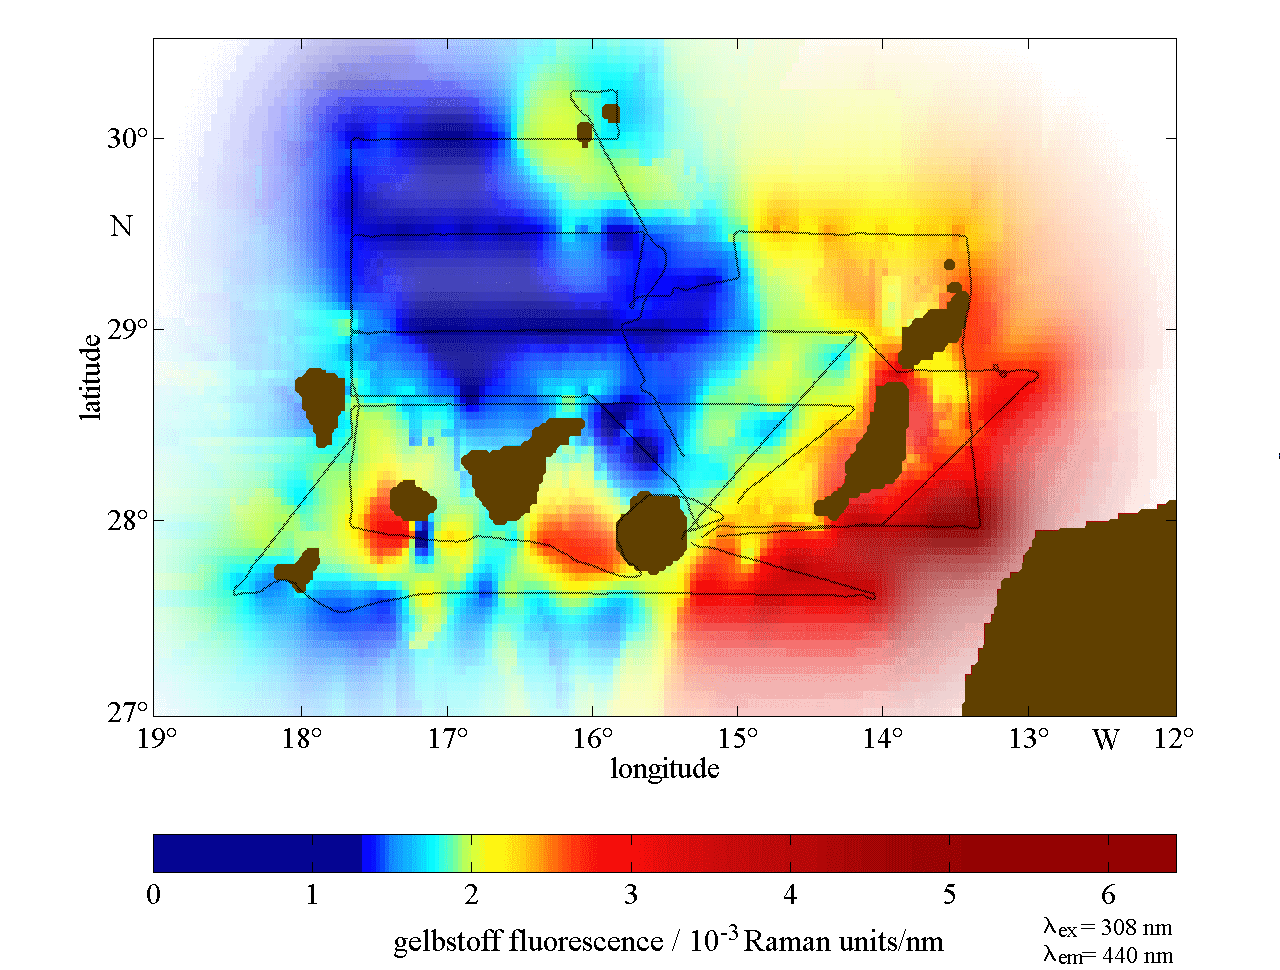
The CDOM data in the Canary Islands show a structure which is typical for oceans:
- Further away from the coastline, fluorescence is very low (blue colour) because fluorescent molecules near the water surface are easily destroyed by UV radiation of the sun, which is called photodegradation.
- Along the coastline, fluorescence is high because trade winds blowing from northeast cause a coastal upwelling which pushes fluorescent gelbstoff from deeper layers of the ocean to the surface. Coastal upwelling is explained more thoroughly in Chapter 4 of the SEOS Tutorial Ocean Currents.
- In between the islands, we also observe very high signals: an upwelling caused by ocean currents parallel to the coastline takes place, known in oceanography as island upwelling.
Owing to its light-absorbing properties, yellow substances in the ocean can also be derived from Ocean Colour data. However, in areas that are far from estuaries and river deltas, such as the case of the Canary Islands, the concentration of yellow substances is too low to be depicted in Ocean Colour.
