Fiche 4.2 : Un photomètre à absorption pour l'enseignement à l'école (3/6)
Mesure de l'intensité de la lumière
![]() Ce mode de travail est disponible, comme expliqué dans les pages précédentes, après le démarrage du logiciel.
Ce mode de travail est disponible, comme expliqué dans les pages précédentes, après le démarrage du logiciel.
Les données d'intensité ne sont pas mises à l'échelle en unités photométriques telles que W/m2, mais seulement indiquées qualitativement. La sensibilité spectrale des éléments du détecteur n'est pas corrigée ; une intensité en bleu montrée comme étant le double d'une intensité en rouge ne signifie pas que la lumière se comporte de la même manière dans la réalité.
Lorsque l'on retire la fibre du porte-cuvette, les spectres
- les spectres des lampes à économie d'énergie et des diodes électroluminescentes (DEL)
- de la lumière du soleil, réfléchie par une feuille de papier blanc (ne pas mesurer la lumière du soleil directement !)the sunlight, reflected by a white piece of paper (do not measure the sunlight directly!)
- du ciel bleu et des nuages/li>
- de la lumière du jour réfléchie sur des vêtements colorés
![]() Il existe un autre effet des détecteurs qui peut être facilement corrigé. Même dans l'obscurité,
ils produisent un petit signal appelé courant d'obscurité. Dans l'obscurité totale, une valeur
d'intensité d'environ 1000 peut être observée. Pour voir cette valeur dans la fenêtre de données,
l'échelle de l'axe d'intensité doit être ajustée par le symbole montré à droite.
Il existe un autre effet des détecteurs qui peut être facilement corrigé. Même dans l'obscurité,
ils produisent un petit signal appelé courant d'obscurité. Dans l'obscurité totale, une valeur
d'intensité d'environ 1000 peut être observée. Pour voir cette valeur dans la fenêtre de données,
l'échelle de l'axe d'intensité doit être ajustée par le symbole montré à droite.
Lorsque l'on rattache la fibre au porte-cuvette, l'intensité de la lumière transmise à travers la cuvette peut être mesurée (sans correction spectrale de la sensibilité des détecteurs).
Après avoir inséré la cuvette dans le support, il faut la fixer à l'aide d'une plaque coudée ; la plaque a une petite ouverture d'un côté pour permettre le passage de la lumière et doit être alignée avec le reste. Si la plaque empêche le passage de la lumière, le courant d'obscurité peut être examiné ; dans le cas contraire, la lumière doit passer librement. Des feuilles colorées peuvent être ajoutées à l'ouverture pour empêcher le passage de certaines parties spectrales.
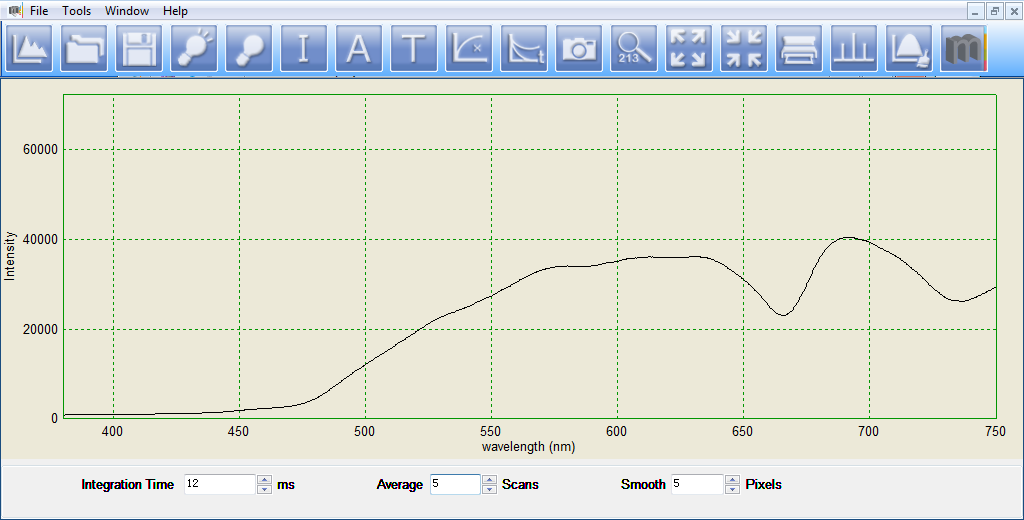
L'image suivante montre, à titre d'exemple, le spectre de la lumière après avoir traversé une solution contenant des pigments de feuilles, en particulier de la chlorophylle, dans de l'alcool. On peut voir que les intensités dans les plages bleues et rouges sont remarquablement affaiblies par l'absorption de la chlorophylle. Les petits signaux aux longueurs d'onde inférieures à 400 nm sont dus au courant d'obscurité.

