Supplément 2.6: Différentielles et dérivations (3/4)
La température comme exemple ... (suite)
La dérivée totale de la température peut être donnée si les variables spatiales ou le vecteur de position sont des fonctions du temps :
C'est évidemment le cas pour l'air en mouvement ou l'eau qui s'écoule si le vecteur de position marque la position changeante dans le temps d'un élément d'air ou d'eau défini. Il s'ensuit que
Ainsi,
sont les composantes de la vitesse de l'écoulement dans les directions , et .
En notation vectorielle :
ou avec le vecteur vitesse :
En océanographie et en aérodynamique, comme en météorologie et en océanographie, des mots spécifiques ont été créés pour ces termes :
-
est la forme lagrangienne : les coordonnées spatiales et le temps sont variables, c'est-à-dire qu'un élément d'air ou d'eau est observé dans le temps alors qu'il se déplace dans l'espace et que son changement de température est décrit.
Dans les expériences, par exemple, cela peut être réalisé au moyen d'un thermomètre placé dans un ballon à flottabilité neutre qui suit le vent comme un élément aérien ; dans les eaux ou la mer, il s'agit d'un flotteur à flottabilité neutre qui suit le courant de l'eau. -
est la forme eulérienne : le temps est variable alors que la position est fixe. La température du flux d'air ou d'eau qui passe est mesurée pendant ce temps. C'est pourquoi on l'appelle aussi dérivée locale.
Dans les expériences, cela peut être mis en pratique à l'aide de capteurs montés à un endroit fixe, par exemple avec une station météorologique installée ou une bouée de données fixée au sol. Des exemples de données de température de la mer collectées par une station de mesure installée dans la mer des Wadden, en Basse-Saxe, près de l'île de Spiekeroog, font l'objet d'une discussion approfondie dans le didacticiel SEOS sur l'analyse des séries temporelles. - est appelé le terme convectif : il inclut le gradient de température, c'est-à-dire le changement spatial de température qui est multiplié par le vecteur vitesse. Ajouté à la forme eulérienne, le terme convectif donne la forme lagrangienne du champ de température.
Les ballons météorologiques, qui sont importants pour les prévisions météorologiques, ne se comportent pas selon l'approche lagrangienne puisqu'ils ne flottent pas dans l'air mais s'élèvent jusqu'à environ 30 km dans le ciel afin d'enregistrer les profils verticaux de la température de l'air et d'autres paramètres.
Les bouées dérivantes dans l'océan répondent beaucoup mieux aux exigences : elles flottent comme le montre le Global Drifter Program avec le courant à la surface de l'eau ou elles flottent à une profondeur de 1000 à 2000 m comme le font les bouées Argo. Ces dériveurs dits lagrangiens peuvent fonctionner de manière autonome pendant un à deux ans avant de nécessiter un entretien.
L'image ci-dessous montre des trajectoires de dérive (également appelées trajectoires) qui ont été enregistrées au sud de Porto Rico à l'aide de bouées dérivantes. Les mesures servent à l'examen des courants océaniques, les données de température n'ayant pas été collectées. Elles montrent à quel point le courant peut être variable, même dans une petite zone côtière.
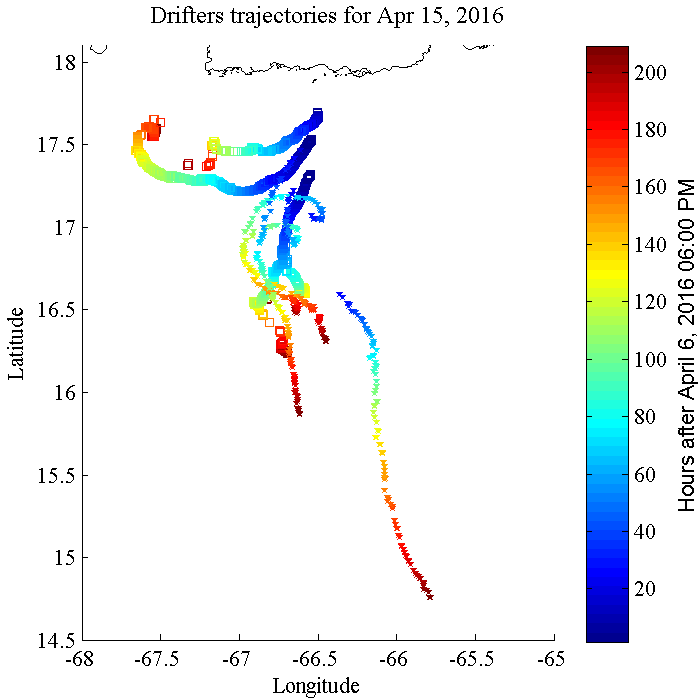
Source: Caribbean Coastal Ocean Observation System (Caribbean IOOS).
Les cartes mondiales suivantes de la température de la surface terrestre sont des instantanés, comme expliqué dans l'encadré « Moins de variables » à la fin de la page précédente. Le temps n'apparaît pas comme une variable. Au lieu de cela, les températures mesurées au cours d'une journée ou de plusieurs jours sont accumulées dans une seule carte. De tels instantanés sont appelés représentation synoptique, c'est-à-dire une représentation globale de plusieurs données mesurées au même moment ; dans le cas d'ensembles de données globales, cet objectif ne peut pas être entièrement atteint.
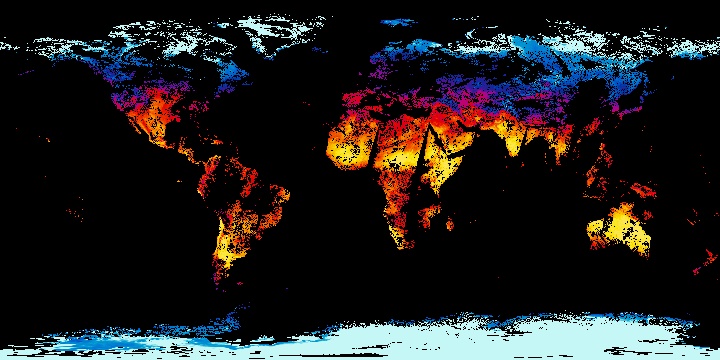
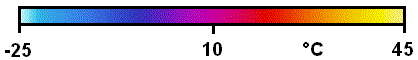
Source: NEO - NASA Earth Observations.
En préparant une vidéo à partir d'instantanés chronologiques, on obtient une présentation lagrangienne puisque les coordonnées spatiales (ici : en deux dimensions) ainsi que le temps sont pris en compte. Sur la page Liens, vous trouverez une référence menant à une vidéo sur les températures de la surface terrestre sur plusieurs années publiée dans le NASA's Earth Observatory comme exemple d'une présentation lagrangienne des températures globales.
