2. Thermal Radiation
The climate crisis (1/3)
The time series of the Mauna Loa Observatory in Hawaii
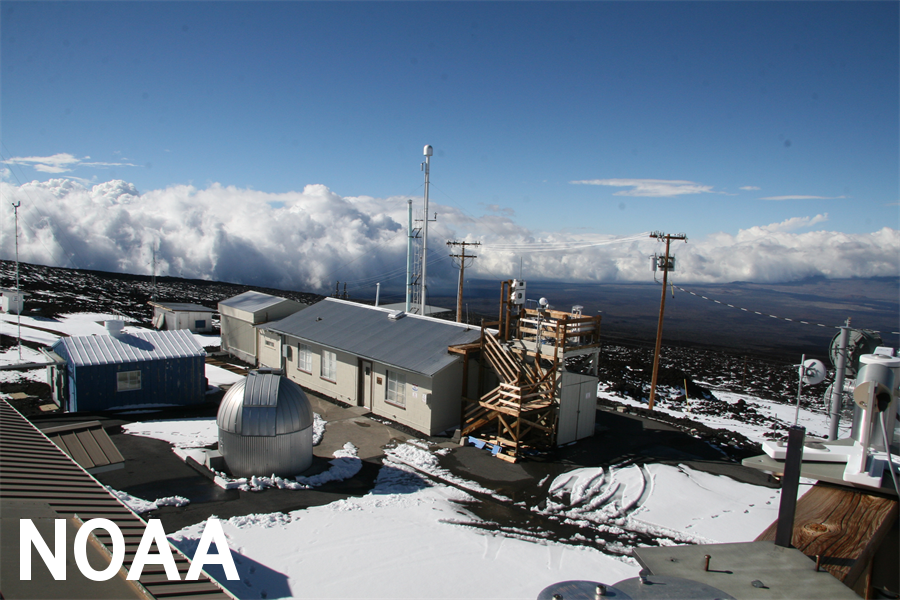
In a laboratory of the U.S. Atmospheric and Oceanic Administration NOAA on the mountainside of the Mauna Loa volcano on the island of Hawaii, the concentration of CO2 has been measured at 3397 m above sea level since 1959. This is the longest time series available for CO2 in the atmosphere. It documents the concentration present in Hawaii at this altitude. Mean values representative of the entire surface of the Earth, shown on the next page, are available for the period since 1979.
The Mauna Loa time series is updated monthly and published on the internet. In addition to graphics, numerical values are also available. It also includes the greenhouse gases methane (CH4), nitrous oxide (N2O) and sulphur hexafluoride (SF6).
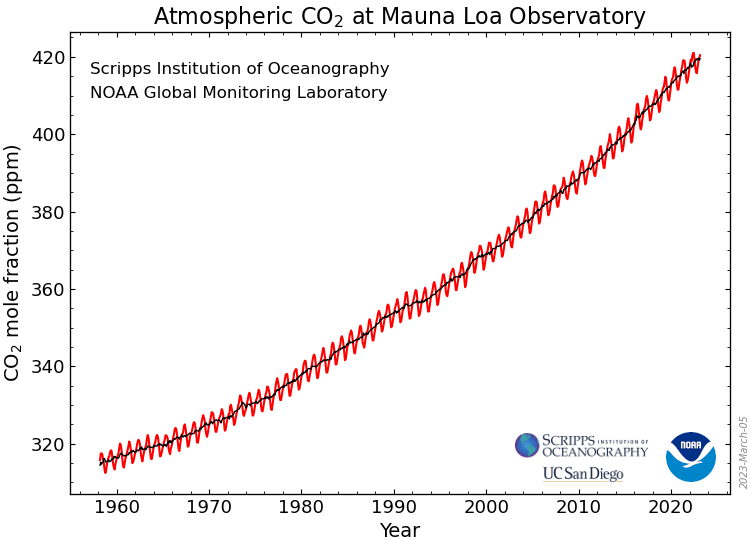
Right: Section of the time series from January 2019 to February 2023. The vertical black lines indicate the uncertainty of the measured value.
Source: NOAA Mauna Loa Observatory, Hawaii, USA.
The unit at the ordinates of the two graphs is the mole fraction of carbon dioxide as the ratio of this component to the total number of moles of all components of air. It is given in ppm (parts per million), i.e., in parts per million or 10-6. 400 ppm CO2 thus correspond to 400 millionths or 0.4 thousandths or 0.04 per cent.
