Geomorphological zonation - Distinguishing the different parts of a reef
To understand this page better, start with playing the game, where you get to know the different parts of a reef.
Geomorphological zones of a coral reef usually have distinct boundaries
but are not easily recognizable on a simple satellite image.
A complex procedure has to be followed to visualize all these structures more clearly, so different classes of
geomorphology can be determined.
- the delineation of the geomorphological zones boundaries,
- their visualization on a map,
- together with a guiding classification scheme (or legend)
Let's explore what needs to be done to have a nice classification as result…
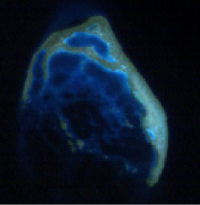
1st ingredient = an original True Colour Composite (TCC)
Everything starts with a satellite image. The blue, green, and red spectral bands of this Landsat 7 ETM+ image will be the input data. These bands were selected as they contain most of the information concerning the submerged coral reefs.
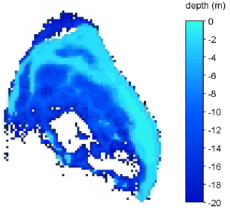
2nd ingredient = a bathymetric map
The differents parts of the reef (= geomorphological zones) we want to line off depend on depth. Therefore, a map which contains the topographical information of the seafloor (= bathymetric map) is needed.
Mix 1st ingredient and 2nd ingredient
= a Depth-improved Color Composite (DCC)
Now we have to merge together the spectral information (1st ingredient) together with the topographical information (2nd ingredient). The result of this composition is called a Depth-improved Color Composite.
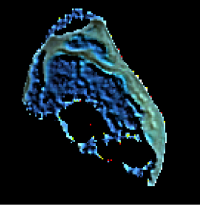
This DCC forms the base for the geomorphological mapping. When compared to a simple satellite image (ingredient 1), the advantage of integrating bathymetric information for the delineation of geomorphological zones is clearly noted.
Final result = geomorphological zonation
The different geomorphological zones can be integrated in a GIS and converted into a nice map.
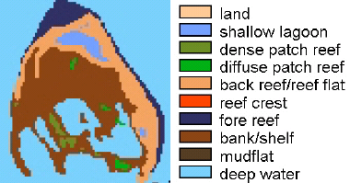
An additional scheme gives extra information on each of the different geomorphological classes:
| Level 1 | Level 2 | Description |
|---|---|---|
| 1. Land | As defined by the landmark | |
| 2. Patch reef | Relatively small coral formations with unclear morphology formed by hard corals or dead corals colonised by new organisms | |
| 2.1. Dense patch reefs | Areas of agregated coral colonies where the corals cover more than 70% of the benthos | |
| 2.2. Diffuse patch reefs | Areas of dispersed coral colonies where the corals cover less than 30% of the benthos | |
| 3. Reef crest | The shallowest and often emergent part of a reef, it seperates fore reef from back reef and lagoon | |
| … | … | … |
