2. Introduction into the Mathematical Methods
Covariance and correlation (2/2)
In this correlation matrix the diagonal elements from top left to bottom right are all 1. This is because they contain the variance for that variable in the covariance matrix, and this gets divided by the standard deviation from that row and that column, that is it gets divided twice by the standard deviation.
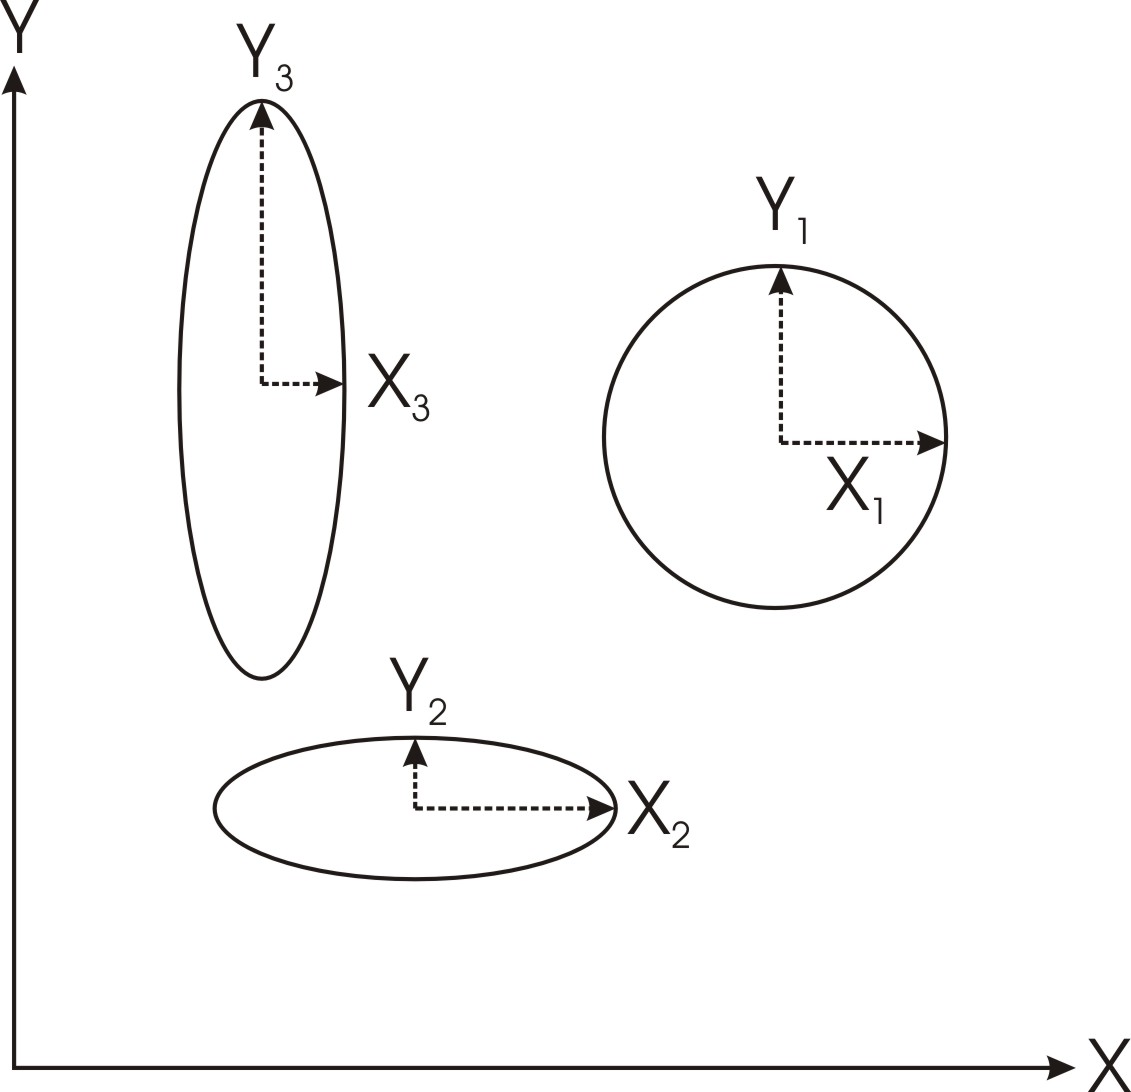
When two variables are uncorrelated, then the off diagonal elements are zero in both the covariance and correlation arrays. We can plot the covariance array in two dimensions, forming circles or ellipses in this two dimensional space. We do this by marking the mean values for a class in this two dimensional space, and then marking the standard deviation either side from this mean value, and in the same direction as the relevant axis. If the data are uncorrelated, then ellipses or circles will be formed as shown in the figure on this page. If the standard deviations are the same in both dimensions being plotted, then a circle will result, otherwise an ellipse, with its semi-major axis parallel to the axis exhibiting higher standard deviation values.
If there is covariance or correlation, then ellipses will result, oriented at an angle to the two axes, this angle is depending on the covariance between those two values. The figure on the previous page shows the covariance for two different samples which have correlated data. Sample 1 (X1,Y1) has positively correlated data so that an increase in x is normally matched by an increase in y. Sample 3 (X3,Y3) has negatively correlated data, so that an increase in x is normally matched by a decrease in y. The orientation of the axes of the ellipse indicates positive or negative correlation. Correlation is zero when the ellipse semi-major axis coincides with either the x or the y axis, and reaches a maximum of 1 when the semi-major axis is at 45° to these axes.
There is a mathematical concept of correlation and covariance, which can be calculated using matrix calculation.
If there are structures shown in a scattergram, which are diagonal to the x or y axis, the two variables or in a satellite image sensor channels are somewhat dependend to each other, they are correlated.
