2. Introduction into the Mathematical Methods
The frequency distribution
Automatic classification of satellite data uses enhanced statistical methods. This second chapter gives a short introduction into those mathematical methods.
If you grab a dice and throw it 30 times, recording the number that you get each time, you might get a set of data like that shown below.
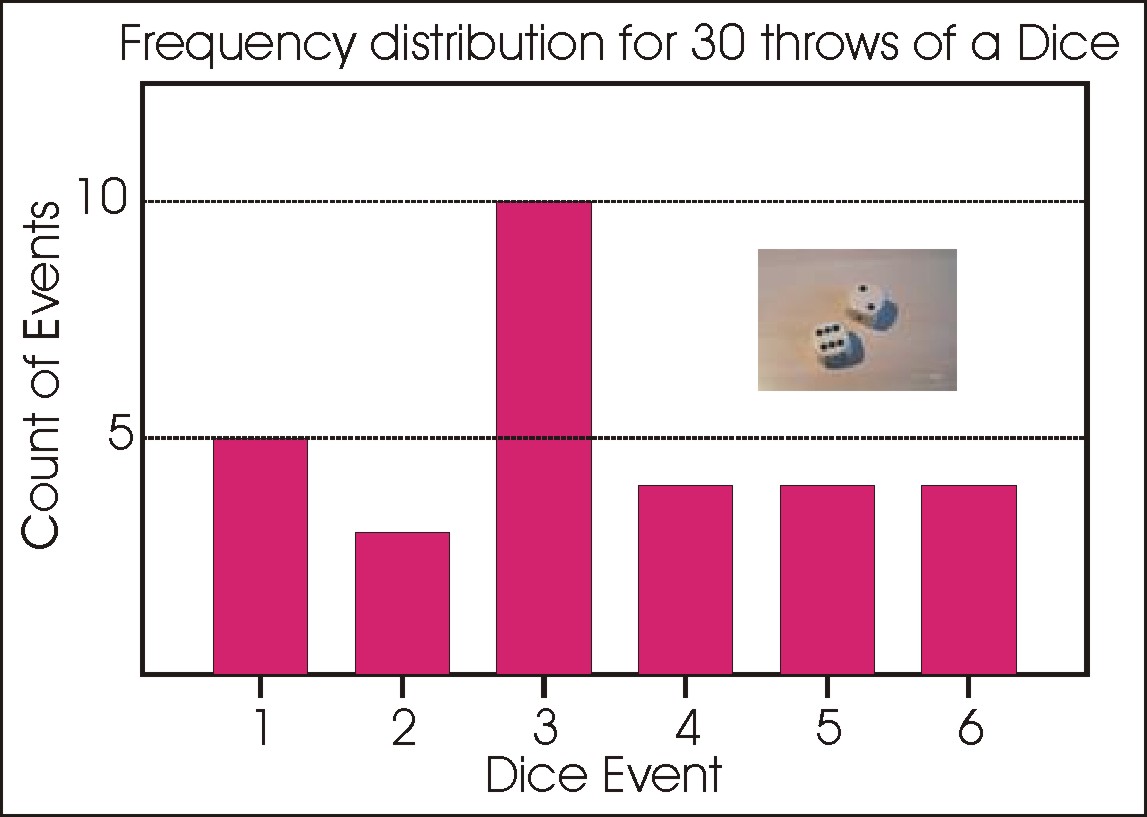
Now, with a dice you can only get 1, 2, 3, 4, 5 or 6, all discrete values, so this is called discrete data. These numbers 1, 2, 3, 4, 5 and 6 are the domain for a dice; this means that they are the only values that can be taken with a normal square dice. Counting how many times each number occurs in your data will give you a table like the one below.
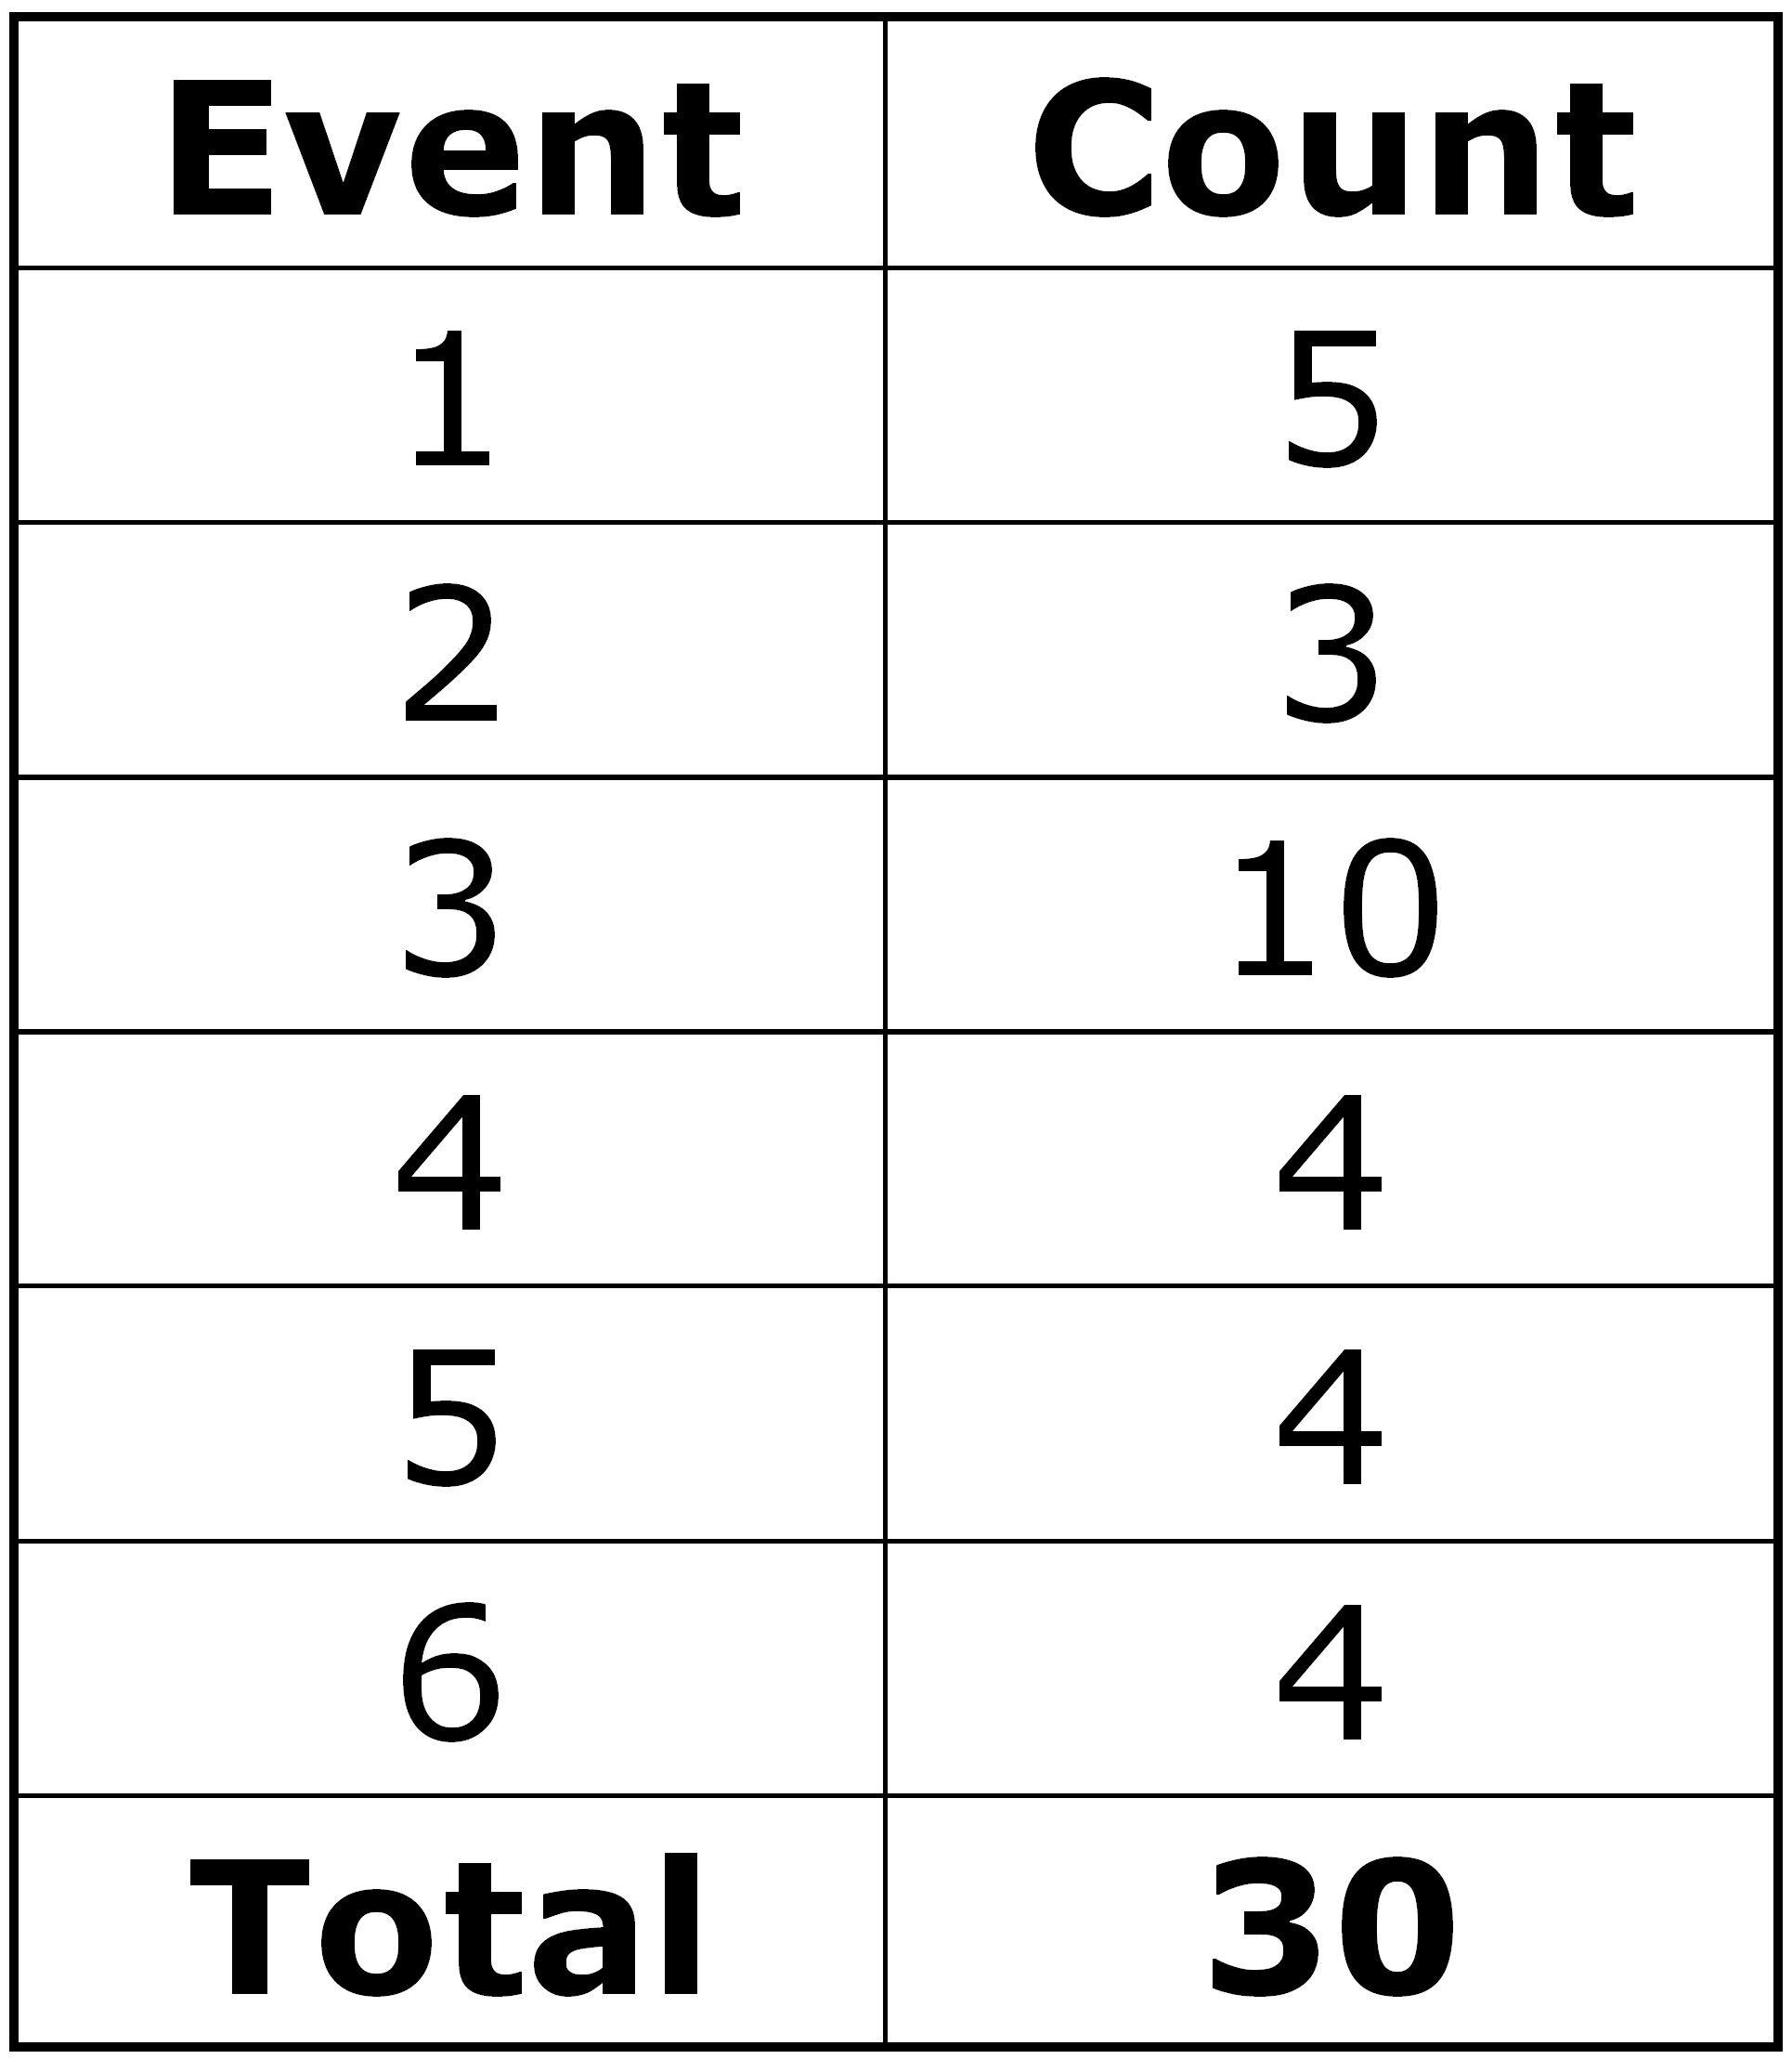
You can plot this as shown, in, for example, a spreadsheet. This is a Frequency Distribution for discrete data:
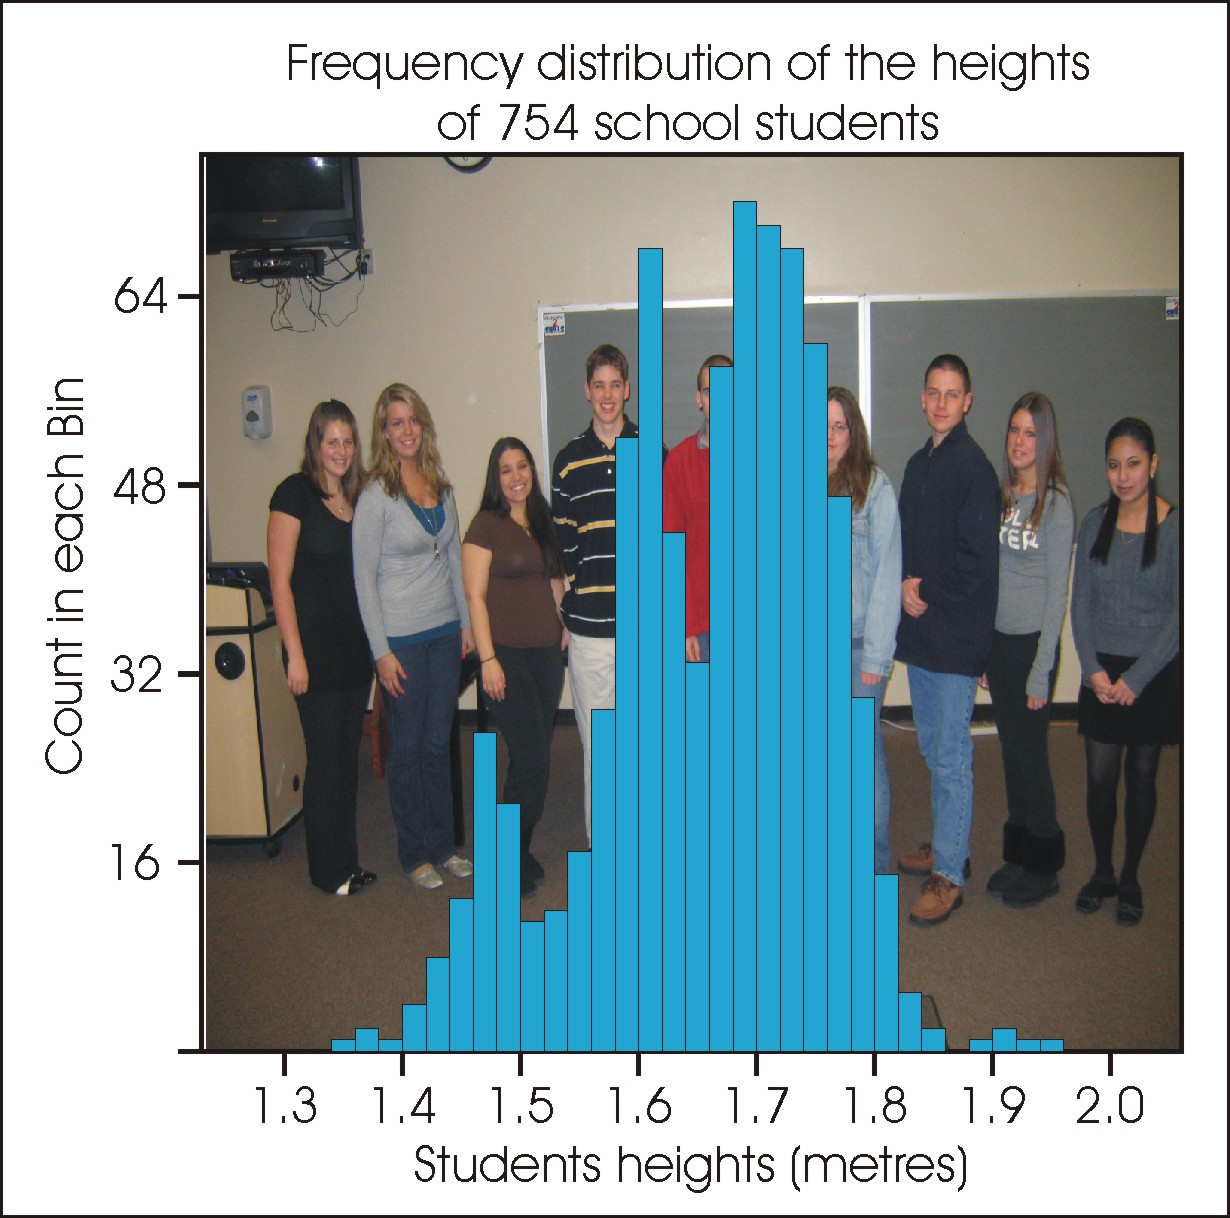
But what if your data is continuous data, that is it can have any value over a range of values, such as the heights of people. How do you make a Frequency Distribution for such data?
Take your data and find its maximum and minimum values so as to get the range of values that your data covers. Decide on how many columns you want in the Frequency Distribution, and divide this range by this number of columns or bins. From your data, find out how many data values occur in each bin. Once you have done this, you can plot your histogram.
Question:
What do you learn about your data from a frequency distribution?
Exercises, tutorials and answers