1. Introduction to Categorisation of Objects from their Data
Finding similar objects (2/2)
From the graph below we can learn about the reflectance of water, soil and vegetation in different wavelengths. The greater the reflectance in the visible range, the brighter this type of landcover looks in an image.
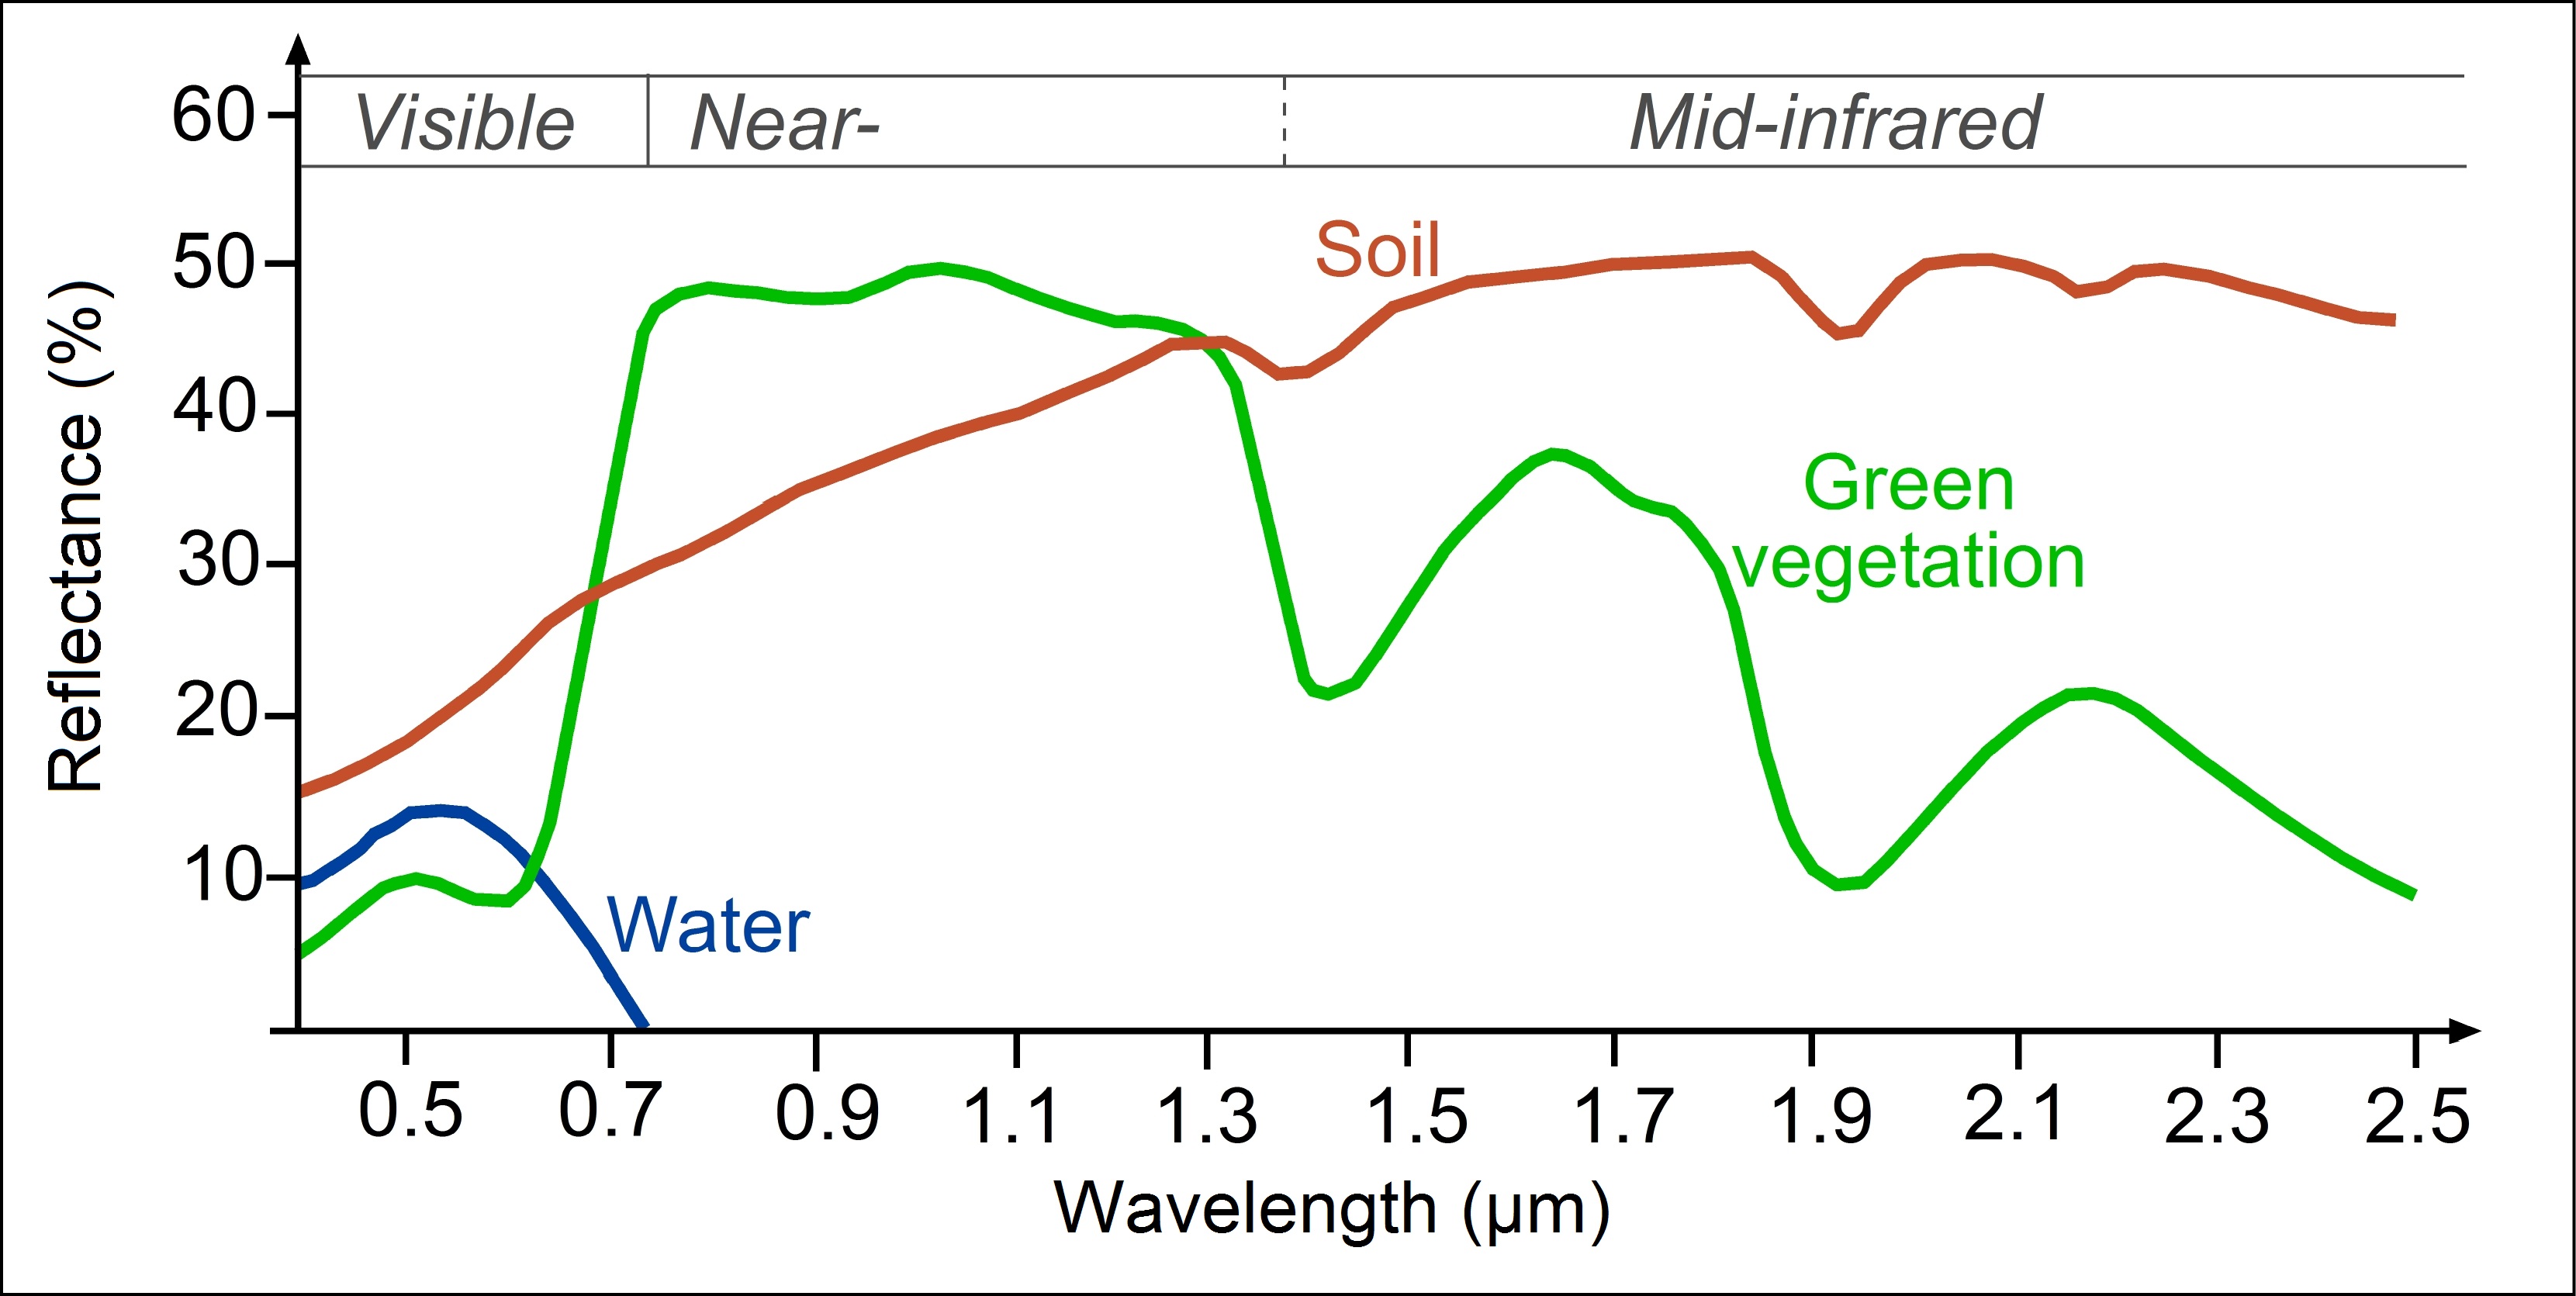
The three curves are fairly close in the visible spectrum, meaning that the reflectance of water, soil and vegetation is quite similar. If we want to distinguish the three types of landcover we will have to look at longer wavelengths, in the infrared range of the electromagnetic spectrum.
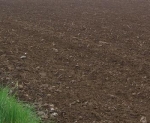
The reflection from soil (bare ground) increases slightly from the visible to the infrared range of the spectrum. There are great differences between different types of soil, dry and humid land. Different mineral compositions of the surface are also reflected in the spectral signature. In the graph above only an average curve for soil (bare ground) is shown.
Generally, water only reflects in the visible light range. As water has almost no reflection in the near infrared range it is very distinct from other surfaces.
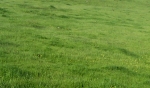
The spectral signature for green vegetation is very characteristic. The chlorophyll in a growing plant absorbs visible and especially blue and red light to be used in photosynthesis, whereas near infrared light is reflected very effectively as it is of no use to the plant. In this way the plants avoid unnecessary heating and loss of juice through evaporation. Therefore the reflection from vegetation in the near infrared and in the visual range of the spectrum varies considerably.
Satellite sensors receive signals in different wavebands. These spectral ranges are called channels.
The figure below has been amended by the channels of the NASA satellite sensor Landsat TM. With 7 channels, the satellite
has a high spectral resolution.
The visible range of the electromagnetic spectrum is detected in three seperate channels: blue, green and red light are
represented by Channels 1, 2 and 3.
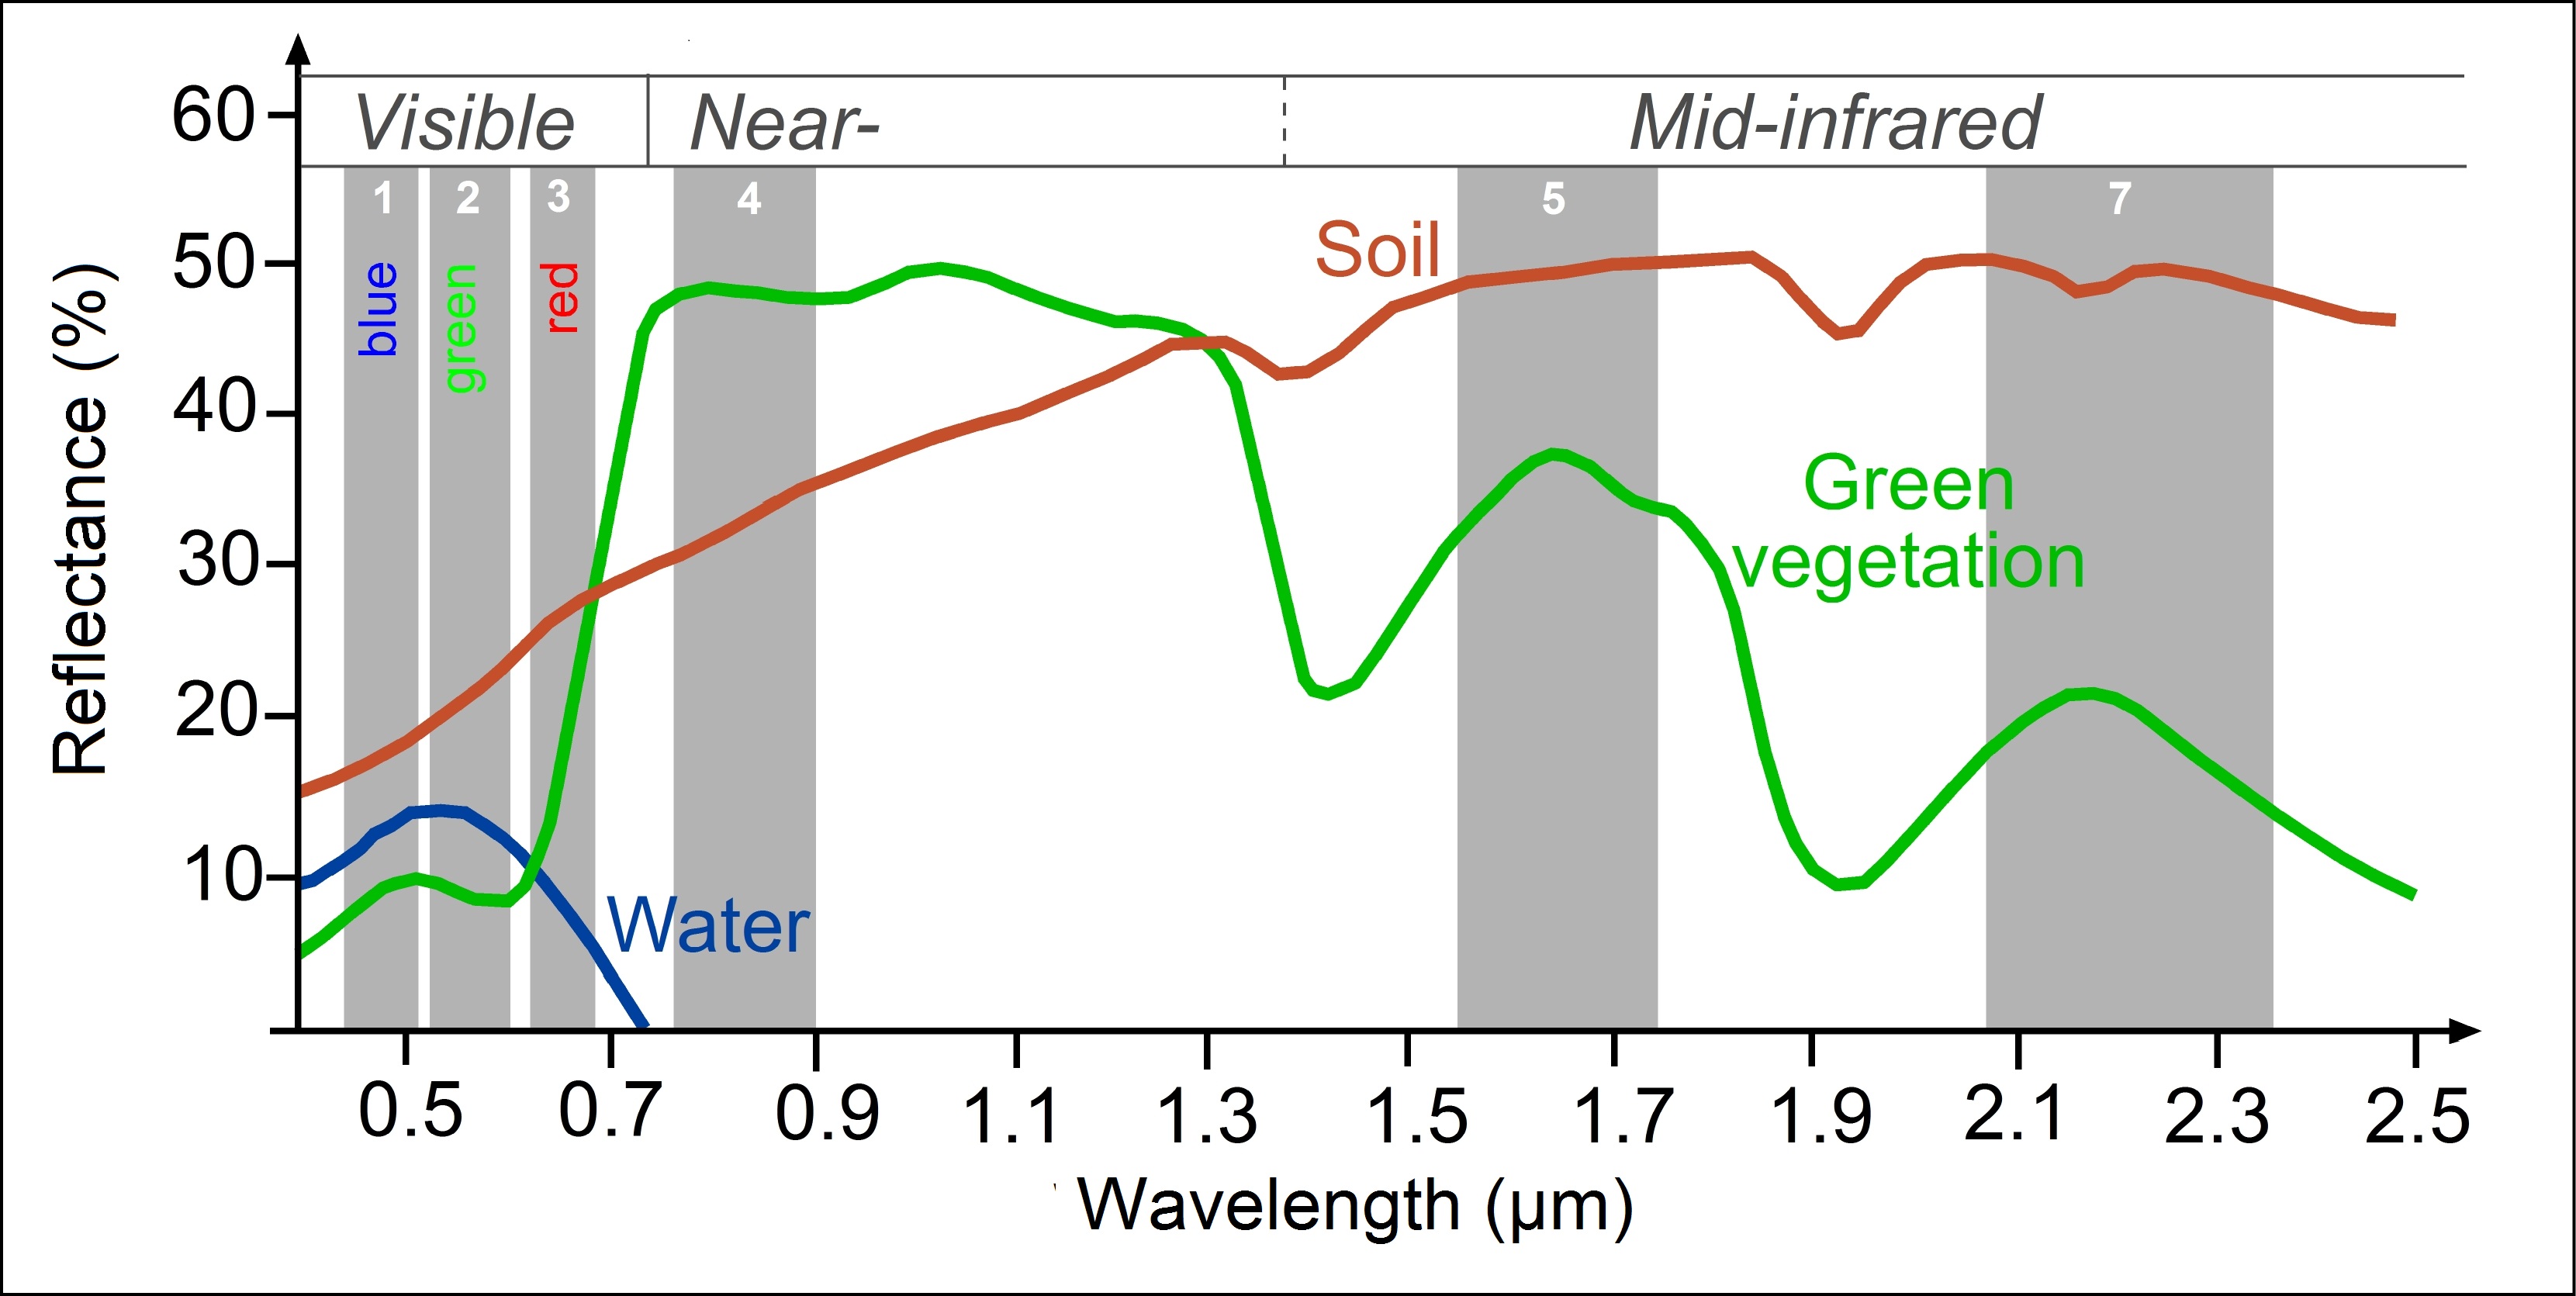
Note that the signal intensities measured in one channel are mean values. The strong ascent of the vegetation curve in Channel 3 for example, cannot be represented in the data but yields a mean value over the slope.
Questions:
- Water reflects electromagnetic waves only in the visible spectrum. If you wanted to distinguish water, soil
and vegetation in an image, which wavelength would you choose to get the best result?
- What do you expect water to look like in a LANDSAT image if you choose channel 5?
- What would you see in an image if there was a channel with 1.3 μm wavelength?
- How many maxima are there in the reflectance curve for vegetation? At which wavelengths and in which
channels are they?
- Which channel(s) would you choose if you wanted to distinguish vegetation from bare ground?
- What do you expect an image to look like if you choose either channel 1, 2 or 3? What happens if you combine
the three channels?
In this tutorial you can learn:
- how to classify objects (data) into groups
- about the statistical operations needed for classification
- how to classify different areas in a satellite image by yourself
