4. Precision Agriculture
Use of GIS in Precision Crop Management
There are cases where spatial variability of more than one factors within a field needs to be considered, in order to effectively deal with a situation. For example, in order to estimate how fast a weed will spread in the field, we need to know more than the original location where the weeds where identified. Soil moisture and soil organic matter can also vary within the field and affect the rate of expansion of the weeds.
Source: Davis, G., Casady, W. and Massey, R., 1998, Precision Agriculture: An Introduction, University of Missouri
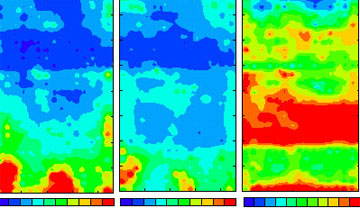
Some data, such as soil moisture, vegetation cover, and chlorophyll content can be measured through remote sensing. Other soil properties however, require sampling of soil cores and analysis of those samples in a lab. As long as the location of the samples is recorded through a GPS, it is possible to create a soil map of the field, for each characteristic of the soil. In the previous example we can see a map of a field for each of phosphorus (P), potassium (K) and acidity (pH).
As long as all the information is geo-referenced to a common projection system of coordinates, it is possible to convert this information in GIS layers and use the GIS software to combine the layers, in order to produce more information about the situation of the field. (If you want some information on what is a GIS, click here).
Question: Look at the previous images. Can you identify and explain any relationships between the three images? Are acidity, phosphorus and potassium concentrations related in any way?
By using the appropriate source data, it is possible to use a GIS in order to model processes that are affected by such data, and predict what the effect of this process will be in the future. For example, by combining soil, vegetation and meteorological data, it is possible to estimate the potential yield of a field, assuming no other factors will influence the normal vegetation growth. With these models we can spot problematic areas in the field, identify the cause of the reduced yield and take the appropriate measures to deal with the problem.
We have already seen that information from remote sensing data such as plant population can give us an estimate of crop yield. The use of GIS however, requires more information (more different layers) but through modelling can provide a more accurate crop yield prediction and also help us identify potential problems.
