Supplement - Geographic Information Systems (GIS)
What is a GIS?
GIS is a computer system that is used to capture, store and analyse data and information with a geographic aspect. The actual system consists of hardware (computer and peripherals such as scanner and printer), software, data that are stored on the computer and the personnel/user that will use the software to analyse the data.
The geographic aspect of GIS data means that each data entry is associated with co-ordinates in the 3D space and refer to a location on the earth. The area that the data represent can be a point, a line or an area.
The data are organised in thematic layers. For example, a layer of "amount of crop produced" could be a layer where areas (polygons) are defined and represent a field, which has a value associated with it, that represent the amount of crop produced by that field in a certain year.
Source: National Coastal Data Development Centre (NCDDC), National Oceanic and Atmospheric Administration (NOAA), USA
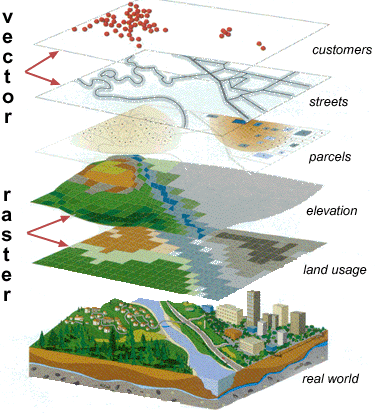
The data in a GIS layer can be in one of two formats; vector or raster. Vector data are the more common format of GIS data. As mentioned above, features in the vector system can be points, lines or polygons. Each of those features can be associated with one or more values in a thematic layer. Vector data are very accurate spatially. On the other hand, raster data organise space in a grid. Each of the squares is treated as a vector polygon and also has one or more values associated with it. Raster data frequently originate from remote sensing imagery, because the sensor records the data in pixels.
In the figure above, the layer "customers" contains points, layer "streets" contains lines and layer "parcels" contains polygons. All those are vector layers. On the other hand, layers "elevation" and "land usage" are raster layers and originate from the processing of remote sensing images.
Source: Wikimedia Commons
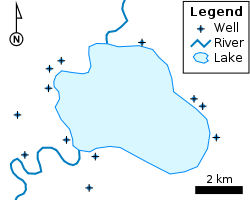
Another example of points, lines and polygons appears on the left. In this map, the wells appear as point features, the rivers as linear features (made up of a sequence of straight lines and making up what we sometimes call a polyline) and the lake is presented as a polygon, since in covers an area in two-dimensions. A polygon is defined as the area enclosed within a closed series of lines (meaning there is no end or beginning in that series of lines).
Uses of a GIS
At the very least, a GIS can be used as a highly sophisticated map, able to provide a large variety of information elements. The fact that the data are stored in digital form makes it possible to produce various thematic maps, depending on the needs. More importantly, the digital nature of the data, allows for the quick manipulation of the data and the execution of various analyses.
By combining more than one layers in a GIS system, each unique point in space is effectively assigned many attributes or characteristics. For example a theater could be represented with a point, which will have a pair of coordinates. Additional information associated with that point could be the name of the theatre, its address, people capacity, and when it was build.
Because all the features are combined in a common coordination system, it is possible to do many spatial operations that combine the location of those features with the associated attributes.
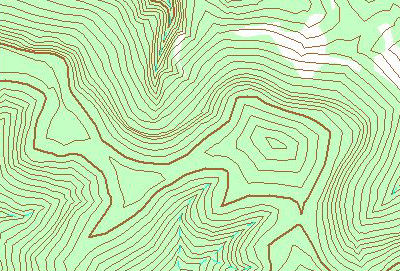
Let's take the example of elevation. Altitude is one of the most common attributes associated with points and lines in a GIS. The use of elevation, allows the portrayal of the map in three-dimensions. But how can we calculate the elevation of any point in the map? The data required for this process are point measurements of elevation. The more point measurements that are available, the more accurate and detailed the elevation map will be at the end. Elevation data from remote sensing measurements are very common, as they can provide a very dense grid of elevation values (see again the "elevation" layer on the figure on the left).
Source: Wikimedia Commons
At the next step the contour lines are formed, joining all points with the same elevation in one uninterrupted line. Now that we have the contour lines, if we make the assumption that elevation increases (or decreases) at a constant pace between two successive contours, we can calculate the elevation of any point on the map.
Question: Is it possible for two contour lines to intersect?
Question: What information does the density of the contour lines give us?
Because all the features are references to the same coordination system, it is easy to calculate the spatial relationships between two or more features. For example we can identify the area that is within a certain range of a selected feature. This characteristic can be combined with other information from existing layers and form a list of criteria that allows the selection of the areas that fulfill those criteria.