2. Crop Yield Estimation
Estimating crop yield using only remote sensing data (2/2)
Source: Satellite Imaging Corporation and SPOT Image Corporation
So how can we estimate crop yield, just by using a remote sensing image? Previous research studies have compared satellite images captured at various dates, with statistical crop yield data of the crop fields appearing in the image (Idso et. al., 1977; Maas, 1988; Serrano et. al., 2000; Shanahan et. al., 2001). The image was usually processed to calculate one or more vegetation indices (more information here) and the values of the indices corresponding to a field/area, were compared with the yield of that field/area.
Many relationships between vegetation indices and crop yield have been created this way. However, each of those relationships is working only for the particular crop, in the specific area and only when the remotely sensed data were acquired at the particular time of the year. Even then, the accuracy of estimating the final crop yield varies from year to year. Nevertheless, the use of vegetation indices alone, is a fast and easy method to make rough estimates of the crop yield.
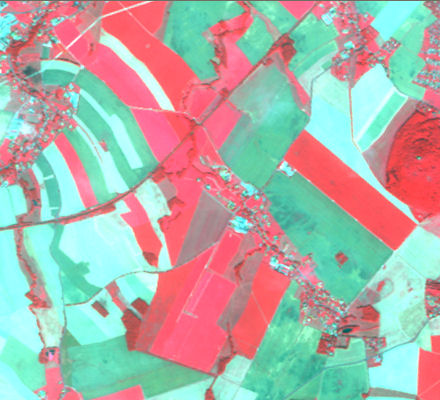
In the two images on the left we can see a false colour composite and the calculated Normalised Difference Vegetation Index. In the latter, there is only one value associated with each pixel, which is why it appears in black and white. White pixels have high NDVI values and black pixels have low NDVI values.
The NDVI is one of the most commonly used indices for studies related to agriculture and vegetation in general, especially when vegetation cover is high.
Question: What similarities can you see between the two images?
