Vegetation Indices
The Normalised Difference Vegetation Index (NDVI)
Let's take a look at the NDVI calculated from a satellite image. In the images below, an area in north-west Peloponese in Greece is shown, captured by a 30-metre spatial resolution LANDSAT TM.
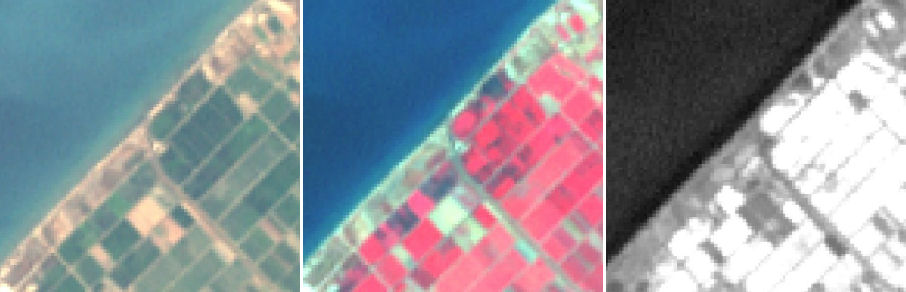
Source: NASA
The left image is a true colour image (red is the red band, green is the green band and blue is the blue band). Agricultural fields occupied by crops appear as green. Different shades of green in different fields represent different crops or the same crops but at different growth stage. Barren ground is brown.
The middle image is a false colour image (red is the near-infrared band, green is the red band and blue is the green band). Here, high near-infrared values represent vegetation, which appear red on the image. Barren grown appears cyan, because there is no vegetation to increase the red colour on the image.
The image on the right is the NDVI for each pixel of the image. Dark pixels have low NDVI, white pixels have high NDVI and grey pixels have average NDVI values.
The Normalised Difference Water Index
Following the same rationale as the NDVI, the Normalised Difference Water Index, employs the near-infrared band and a band in the short-wave infrared (SWIR) (Gao, 1996). Instead of using the red band, the reflectance at which is affected by chlorophyll, a short-wave infrared band in the region between 1500 and 1750 nm is used, a region where water has high absorption. The near-infrared band is the same as with NDVI, as water does not absorb in this region of the electromagnetic spectrum.
The NDWI index is expressed with the following equation:
Let's take a look at the same area in the north-west Peloponese, this time with the NDWI calculated on the right hand side:
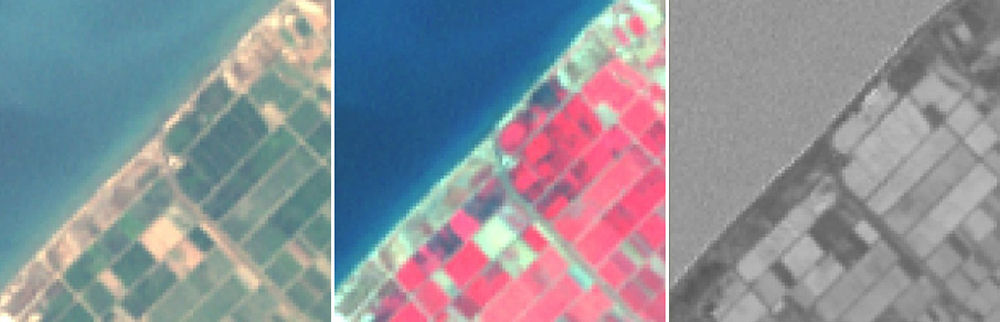
Source: NASA
The black and white NDWI image on the right above represents the NDWI values for each pixel. As with the NDVI image, dark pixels have low values, white have high and gray have average. Notice that in the NDWI image the sea (top left of the image) has high values, whereas for the NDVI image it appears dark. In general it appears that all agricultural fields give high NDWI values, which suggests that the fields are adequately irrigated. Barren fields, appear dark in the NDWI image, which shows that those fields are drier, since they do not receive any irrigation.
Issues with background contribution to spectral signal
The study of vegetation through vegetation indices, has to deal with the problem of vegetation cover. When dealing with thick, dense vegetation, where the canopies cover the surface of the Earth, the recorded spectral signal is originating from the reflected energy off the top of the canopies. However, in cases where vegetation cover is not complete, the features under the canopies become visible. In those cases the proportion of the recorded signal that originates from vegetation equals the proportion of vegetation cover. For example, if the cover is 60%, then 60% of the signal is reflected light from vegetation and the other 40% from anything that is not covered by the canopies.
If the underlying feature is another type of vegetation, the overall signal maintains the typical vegetation signature, but it carries information on two types of vegetation, the one above and the one below. In the case that bare soil is the contributor to the signal, then signal is a mixture of vegetation and soil signal, which are very different.
