Vegetation Indices
The Red Edge
Because the red and near-infrared regions are adjacent (red is approximately between 600 and 700 nm and near-infrared begins at around 700 and stretches to about 1200 nm), the low vegetation reflectance in the red regions is immediately followed by a sharp increase to the high reflectance in the near-infrared. This steep increase in reflectance in the 690-730 nm region is known as the red edge.
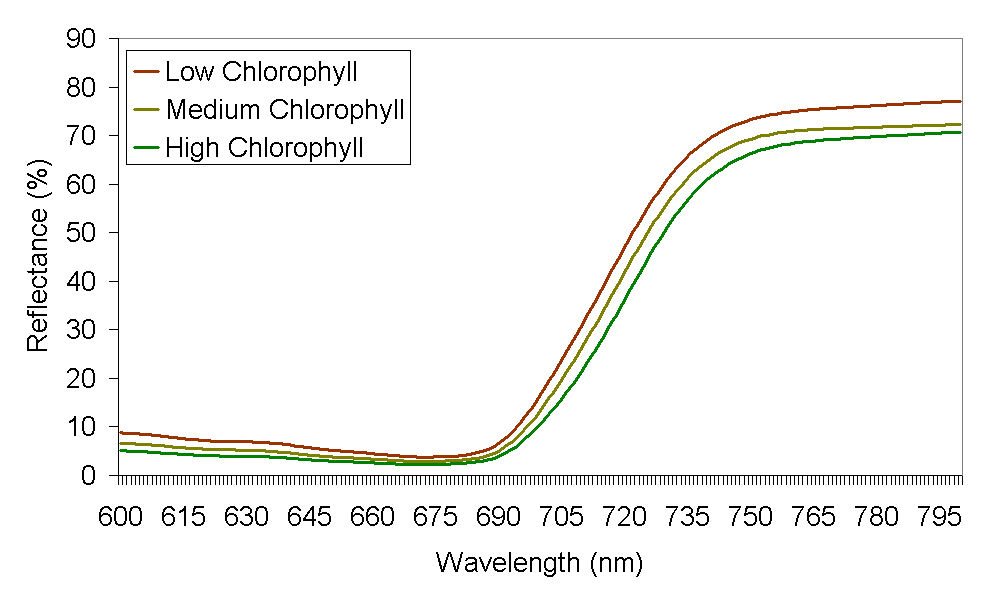
In the figure above, we can see the reflectance of three similar plant canopies. The difference between the three is in the chlorophyll concentration. The red, yellow and green lines are from plants with low, medium and high chlorophyll concentrations, respectively. As chlorophyll concentration increases, the absorbency in the red region also increases, resulting in lower reflectance. In addition the absorption well (the area where the absorbency is noted) increases in width. This causes the red edge to move towards longer wavelengths (towards the near-infrared) and its slope to become less steep.
Question: What happens to the reflectance in the green region, when chlorophyll concentration increases?
Evolution of vegetation indices
Most vegetation indices, take advantage of the difference in reflectance between the visible and the near-infrared region. Since chlorophyll is primarily found in plants and has a unique absorption in the red region, that region is often selected, instead of using the visible region as a whole.
The Normalised Difference Vegetation Index (NDVI)
The first time the reflectance in the red and near-infrared regions were combined, were to measure the leaf area index (LAI) in forest canopies (Jordan, 1969). This first index used the NIR/Red ratio and was later applied using satellite data from LANDSAT/MSS of NASA. Further studies found that the normalised version of the ratio performed better in some occasions, and the Normalised Difference Vegetation Index (NDVI) was introduced. This index is the ratio of the difference of the near-infrared and red reflectance, over the sum of those. It receives values from -1 (no vegetation) to +1 (abundant vegetation).
The NDVI was found to be related to many properties of the plants. It was, and in many cases still is, used to identify the health status of plants, to depict phenological changes, to estimate green biomass and crop yield and in other applications.
However, the NDVI has particular weaknesses. Atmospheric condition and thin clouds can influence the calculation of the NDVI when satellite data are used. When vegetation cover is low, whatever is under the vegetation canopy contributes to the recorded reflectance signal. That can be bare soil, vegetation litter or another type of vegetation. Each of these features has particular and different spectral response to the vegetation that is being studied.
