1. Monitoring Crop Status
Estimating water content from remote sensing
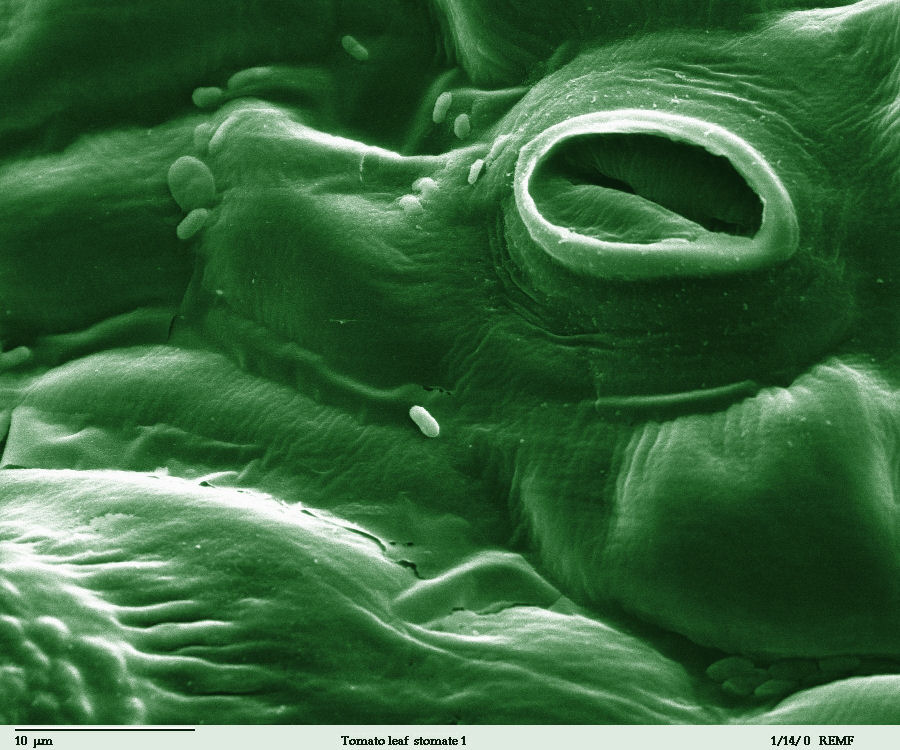
Source: Wikipedia Commons
Like many organisms, plants require water to survive. In addition to the water being used in essential biochemical processes, water is the "means of transportation" for nutrients from the soil to every part of the plant. Water enters the plant through the roots, travels through the main stalk and the branches, eventually reaching the leaves. From there, through the leaf pores known as stomata, it is released in the atmosphere. This process is known as transpiration.
All the biological processes taking place within a plant, produce heat. The transpiring water, captures that heat and removes it from the plant when it transpires through the leaves. When there is not enough water and the plant is under stress, it cannot lose heat through transpiration fast enough and as a result, the plant's temperature increases. This increase in temperature can be detected with remote sensing, by using parts of the spectrum that are sensitive to heat.
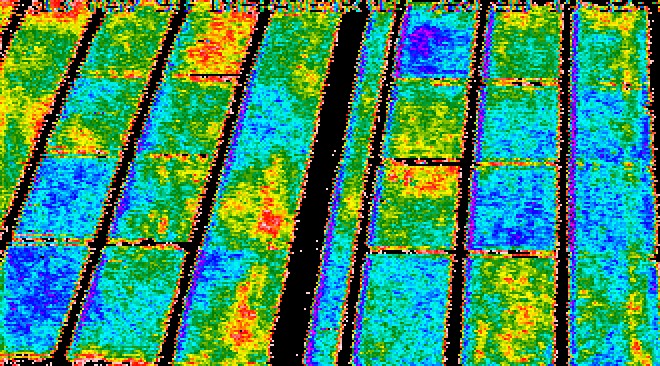
Source: Wikimedia Commons and US Agricultural Research Service
In the image above, we can see the variability of water concentration within each field. Blue pixels represent plants with high water content, green shows plants with average water content and red plants that suffer from low water availability. This variability is because of the variable ability of the soil in different sections of the field, to absorb water and then supply it to the plants.
One of the problems with this method, is partial vegetation cover. When vegetation does not completely cover the soil, the soil temperature is affecting the thermal signal recorded by the sensor. When this happens it is easy to confuse low vegetation cover with hot soil with water stress. However if we have an idea of the amount of vegetation, and particulary the amount of leaf surface per unit of ground area (what is known as leaf area index), we can correct the measurement and reduce the effect of any soil influence.
Monitoring irrigation
When do you think the field appearing in the images below was irrigated?
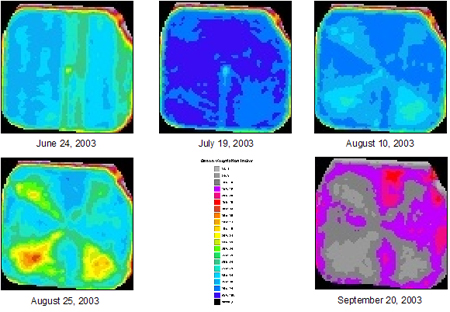
Source: Satellite Imaging Corporation
Remote sensing can provide frequent data, allowing for close monitoring of processes that occur over a small period of time. In the example above, the effects of irrigation on the amount of water within the plants can be seen. Irrigation has taken place between June 24 and July 19, producing high water content in the second image. Gradually, the amount of water is reduced as we move from summer to autumn.
Question: Look at the images above. A pattern is occuring in August and September, where some areas have less water than others. Can you think of any reasons why the pattern changes over time?
