1. Monitoring Crop Status
Identifying stressed plants (2/2)
Before chlorophyll starts to break down in stressed plants, whatever is causing the stress has already started to affect the cellular structure of the leaves. This affects the plant reflectance in the near infrared, even before the loss of chlorophyll changes the reflectance in the visible region. With remote sensing we can see the changes in the near infrared (which are not visible to our eyes) before the chlorotic symptoms appear, and this way we can have an early warning that the plants are under stress.
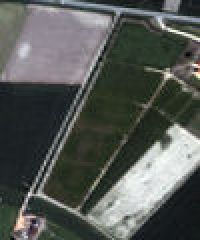
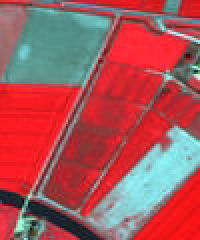
Source: Belgian Science Policy Office and Satellite Imaging Corp
Using vegetation indices with data from sensors with a very high spatial resolution (below 10 metres and even down to a metre!), we can also see areas of the fields where crops suffer from some kind of stress, and estimate how serious it is. Being able to identify stress variations within a field allows the farmer to locate the problem and take appropriate action in order to deal with the problem at the specific location.
In addition to high spatial resolution, sensors with high spectral resolution (i.e. using many narrow bands to cover a wide range of the electromagnetic spectrum) are also very helpful. Being able to get data in the deeper infrared region (short-wave infrared) can give us information about the concentration of particular biochemicals, such as cellulose, nitrogen, water and sugars.
The image below is a classification product of a QuickBird satellite image, using vegetation indices. The green colour represents plants with good health. As the colour moves from green to yellow and then to red, the plant health status is reduced. The gray areas represent barren fields. Depending on the patterns forming, we can make an assessment on the cause of the stress.
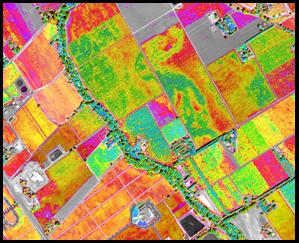
Source: Satellite Imaging Corporation
Question: Click here to enlarge the image above. What is different between plant health variability in areas A and B? Can you explain why?
