Supplement 5.1: Why is Sea Ice Important?
Arctic mirror
Sea ice is important because it reflects sunlight, reducing the amount of energy absorbed at the surface.
The energy balance that determines the temperature of the earth depends on the difference between the quantity of incoming solar radiation, the amount absorbed and reflected, and the radiation emitted by the earth.

Source: National Snow and Ice Data Center
The diagrams show the effect of different surfaces on the amount of solar radiation absorbed.
We use a measure called the albedo to indicate how well a surface reflects solar energy.
Albedo (α) varies between 0 and 1. A value of 0 means the surface is a ‘perfect absorber’ that absorbs all incoming energy. A value of 1 means the surface is a ‘perfect reflector’ that reflects all incoming energy.
How much light is reflected by water and by ice?
The ocean typically reflects just 6 percent of incoming solar radiation and absorbs the rest. A typical ocean albedo is therefore 0.06. Sea ice reflects 50 to 70 percent of the incoming energy. The albedo of bare sea ice varies from approximately 0.5 to 0.7.
Snow has an even higher albedo than sea ice, up to a value of 0.9, and so thick sea ice covered with snow reflects as much as 90 percent of the incoming solar radiation. Sea ice and particularly sea ice covered with snow, absorb less solar energy than open water and keep the surface cooler.
If the amount of sea ice decreases, then more energy is absorbed, making it more likely that more ice will melt. This is a positive feedback effect.
Solar radiation absorbed by the oceans, particularly at the equator and in the tropics, helps drive ocean circulation, with cooling at the poles an important factor.
If more radiation is absorbed in polar regions, the circulation is affected. Ocean currents may change in strength or direction or even stop flowing altogether.

Source: NASA/GSFC/JPL, MISR Science Team
Shiny reflector or rough surface?
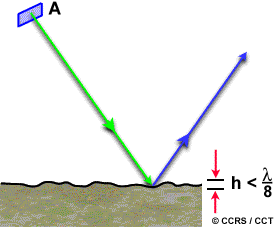
A smooth surface acts like a mirror (top diagram), with the familiar relation
angle of incidence = angle of reflection.
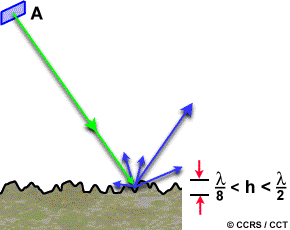
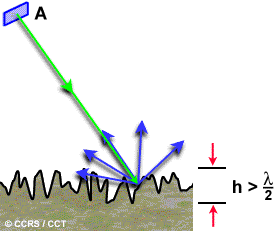
A rougher surface (middle diagram) scatters the incoming radiation in many directions, but the dominant direction is still as for the mirror. A very rough surface (lower diagram) scatters in all directions and there is no preferred direction for the scattered light.


Surface roughness affects reflection and scattering. In general, a rough surface is defined as having a height variation (h) greater than half the incident wavelength (λ). Surfaces will appear to have a greater or lesser degree of roughness, depending on which wavelength is used for imaging. A is the radiation source (an antenna for radar as shown here, or the sun for visible light).
Source: Natural Resources, Canada
Smooth surfaces that behave like a mirror are referred to as specular reflectors. When light is scattered back in the direction of incidence by a rough surface, we talk about 'backscattered' light.
How rough does the surface have to be before we lose the preferred direction for reflection/scattering?
Surface roughness is defined with respect to wavelength and incidence angle. A surface will appear to be smooth if its height variations are smaller than one-eighth of the wavelength.
This means that surfaces can be rough for visible light, but smooth for radar. Even within the visible spectrum, a surface will be less rough for red light than it is for blue.
In terms of a single wavelength, a surface appears smoother as the incidence angle increases.
Radar images rely on backscattering and so rough surfaces will appear brighter than smoother surfaces composed of the same material.
Different types of sea ice have different surface roughness so we can distinguish between them if we view them at different angles.
This can be done in the visible with sensors such as the Multi-Angle Imaging Spectro-Radiometer (MISR) instrument on NASA's Terra satellite, and in the microwave with the imaging radar ASAR on Envisat.
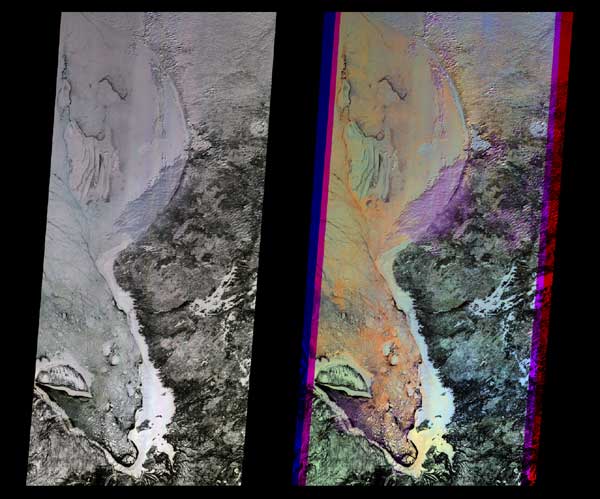
The two images below left show how using different viewing angles as well as different wavelengths can provide more information about the surface. Changes in surface roughness, for example smooth or rough ice, show up clearly in this type of imagery.
Different angles, different wavelengths, different views
The two images to the left are of the Hudson Bay and James Bay area in Canada. The left-hand image is a true-colour (red-green-blue) image from the downward-looking (nadir) camera on the Multi-Angle Imaging Spectro-Radiometer (MISR). The true colour image is made up of three images, one in the red part of the spectrum, one in the green and one in the blue.
The image on the right is a false colour image showing data acquired at different viewing angles but at the same wavelength. It is a composite of red band data taken by the MISR forward 45.6-degree, nadir, and aftward 45.6-degree cameras, displayed in blue, green, and red colours, respectively.
Colour variations in the left image highlight spectral (true-colour) differences, whereas those in the right image highlight differences in angular reflectance properties. The purple areas in the right image are low cloud, and light blue at the edge of the bay is due to increased forward scattering by the fast (smooth) ice. The orange areas are rougher ice, which scatters more light in the backward direction.
See Ocean Currents for more about how the amount of radiation reaching polar regions can affect the circulation, and Earth Spectra for more about reflection.
