5. Ice in the Arctic
Time series - Arctic sea ice extent (3/3)
September series
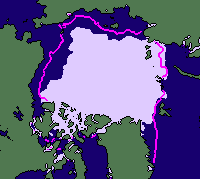
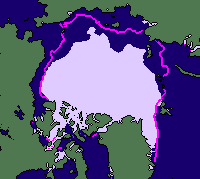
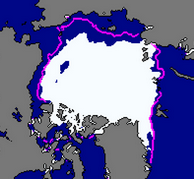
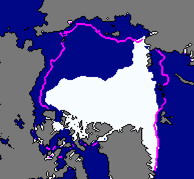
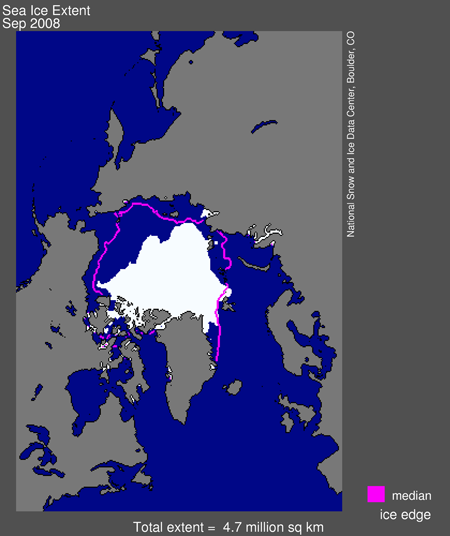
The images on this page show sea ice extent, in September, for five years; 2002 and 2005-2008. The sea ice extent is determined using passive microwave data. See Supplement 3 Page 2 for more about passive microwave data. In September sea ice extent is at a minimum at the end of the summer melt.
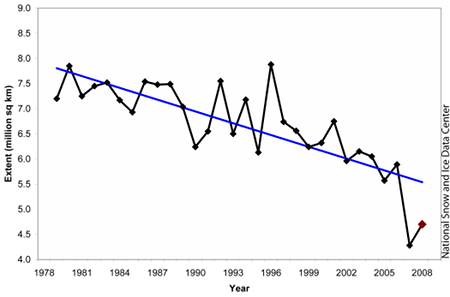
The plot on the right shows the total sea ice extent over thirty years. We can pick out the values for 2002 and 2005-2008. The total extent in 2007 is much less than in 2005 and 2006. But does this mean that there's less ice everywhere in the Arctic in 2007?
What's happening to the east of Greenland?
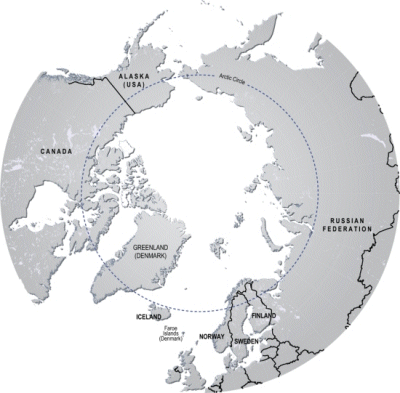
Let's look at the area to the east of Greenland (you can use the map to locate Greenland on the images, even though the projection is a little different).
Along the eastern coast of Greenland there is very little ice in 2002 and in 2008- and there is most ice in 2007.
The total figure for ice extent each year is important when we're looking at changes in Arctic albedo, and how much energy from the Sun is absorbed at the surface.
However, for activities such as fishing or shipping, the local detail is much more important.
Source: National Snow and Ice Data Center
Source: NSIDC
