5. Ice in the Arctic
Arctic sea ice update
In September 2008 Arctic Sea Ice ice extent dropped to the second-lowest level since 1979. The lowest level was in 2007.
The area covered by sea ice in the Arctic varies throughout the year, with an annual cycle of melt and growth. The lowest point is reached in September, after the summer melt. Satellite measurements of sea ice extent have been made since 1979. Satellites can capture the annual cycle as well as changes from year to year.
30 years of satellite data
The graph below shows the September ice extent over the past thirty years, from satellite data. There is a definite downward trend, but also quite a lot of variability.
The image shows the sea-ice extent in September 2008 (white) The magenta line shows the median ice extent for September from 1979 to 2000. The median is a way of showing the most representative cover over the period.
Can you estimate what fraction is left in 2008?
What can time series analysis tell us?
In this chapter we are going to look at how satellite data can be used to study changes in Arctic sea ice extent. Here are some things for you to think about before we continue:
- We have 30 years of data - is this enough?
- Is the annual cycle important?
- How do we merge results from different types of data? e.g. two satellite sensors - radar and infrared.
- Is sea-ice extent on its own a good measure of the changes that are taking place?
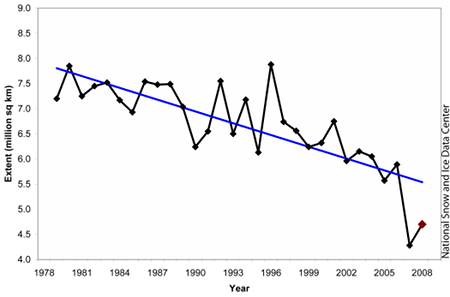
Source: National Snow and Ice Data Center
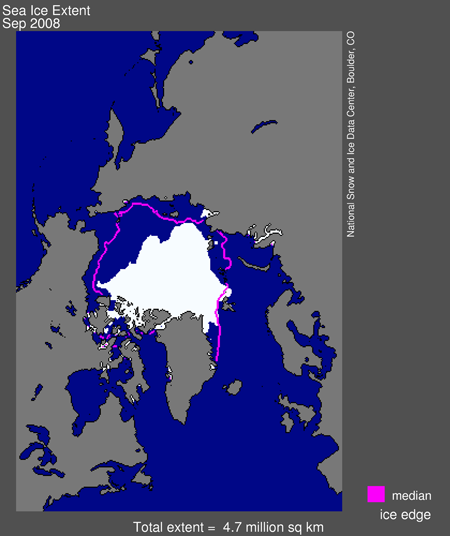
Source: National Snow and Ice Data Center

For the latest ice reports and up-to date information on the state of the cryosphere see The National Snow and Ice Data Center website. Of particular interest are the Arctic sea ice news and analysis and the sea ice index pages that let you look at current and historical sea ice data.
- Sea-ice - what does it look like? - why is it important?
- How we measure changes in sea-ice
- Calculating trends in ice cover
- Making predictions
