1. What is a Time Series and why are they Important?
Point time series
It is difficult to avoid time series − sets of observations arranged according to the time of their outcome. We see them on the web, in the papers, on TV − in almost every subject area you can think of, from economics, politics, crime, health, environmental science. The data may be continuous − measurements made at every instant, for example electrocardiograms − or discrete − measurements at regular intervals, from seconds to years, for example monthly rainfall.
Time series are usually displayed on a scatter plot. The series value is plotted on the vertical axis and time t on the horizontal axis.
Sea level
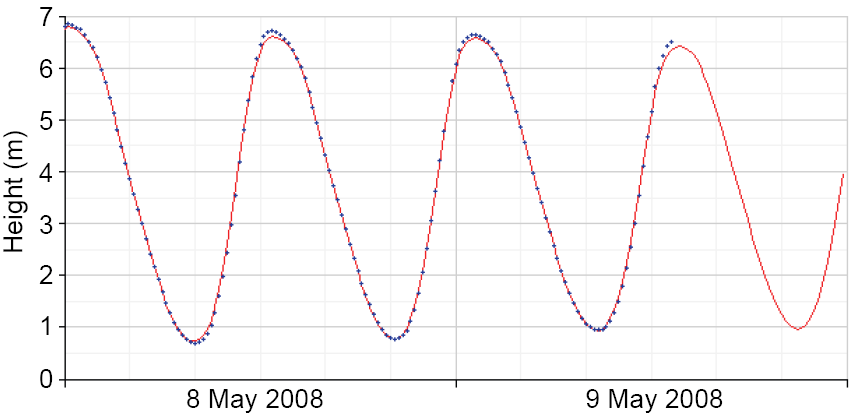
Source: Proudman Oceanographic Laboratory
The plot of the sea level at Dover shows measured data - blue dots. The red line shows the expected values - we understand the way the tide varies pretty well, although changes due to storm surges for example can affect the readings.
The second graph in the right column shows the way the price of a particular type of oil changed from January 1996 to June 2009. The values are ten day averages rather than just daily values. What effect does this have?
This plot looks messier than the tidal record. Why do you think this is so?

Source: Wikimedia, author Theanphibian
Can you use this graph to estimate the price now? Do you need more information in order to get a better answer?
We can ask the same sorts of questions about the Mauna Loa data. Can you use the Mauna Loa time series on its own to predict the carbon dioxide concentration in 50 years time? How good a prediction do you expect it to be? Do you need other types of information to help?
Why are we interested in time series?We would like to understand the forces or processes that produced the observed data before we attempt to predict future values.
In some cases we may already know of and (partially) understand the driving forces, and can perhaps construct a physical model that explains at least some of the behaviour. The time series data can be used to test our understanding. In others we only have the data to work with. The time series may itself suggest the mechanisms that produce the observed data, or may only provide statistical measures that we then use to extrapolate data to give us the predictions we require.
