3. Sustainable Forest Management
Creating Forest Maps

Source: GEOLAND project
With forest maps we can have a good idea about the status of forests at a given time. Such maps can show us the forest species present in each location and provide with useful statistics such as the area covered by each species and the percentage of the total area covered by each species.
By producing forest maps over a number of years, it is possible to monitor the changes that occur in the forests. A series of such maps can allow us to see how the species coverage changes through time, which species are shrinking and which are expanding. This information can provide us with important conclusions regarding the biodiversity and other ecological parameters.
Multispectral remote sensing data, provide forest reflectance in the near infrared, in additon to the visible part of the spectrum. Due to the unique vegetation spectral signature, the combination of reflectance in the different spectral bands, can help us distinguish between different vegetation species. By using a classification procedure, we can identify what vegetation type is present in each section of the image.
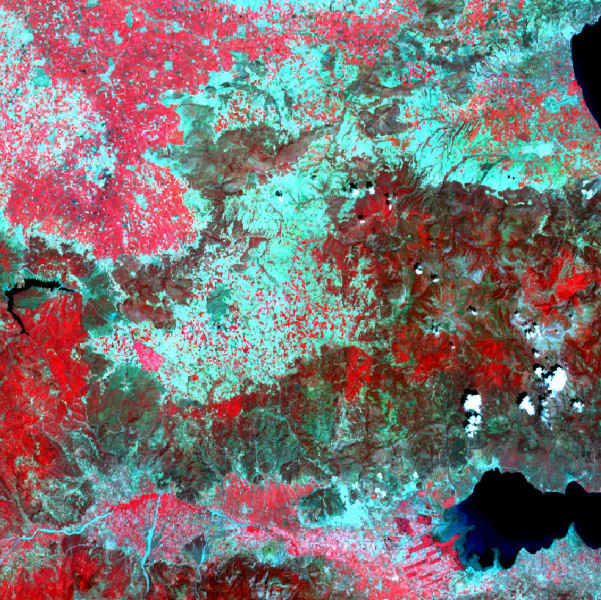
Source: Joint Research Centre, European Commission
Click on the image above. You will notice that some areas are dark red and others are light red. The dark red areas are forested areas on the slopes of hills and mountains. The lighter red areas are agricultural field occupied by crops. Light blue areas are fields that are barren.
In order to combine various information regarding the forests that are sustainably managed, a Geographical Information System (GIS) is usually employed. A GIS can combine and perform mathematical operations between different layers of information with a common geographical background (co-ordinates). For more information on GIS click here.
