Argo floats - operation and data
A float’s working life
When a float is launched its bladder is inflated to keep it floating at the surface. After a few minutes the float sends a test message; then the pumps deflate the bladder and the float sinks.
The float is designed to be a bit less compressible (squashy) than sea water, so it becomes increasingly buoyant as it sinks. At about 1000m depth its density is the same as the surrounding water, and so it stays at that level, drifting slowly with the currents.
2000 metres under the sea
After a while the bladder deflates again, and the float sinks to 2000m. There oil is pumped into the bladder; the float becomes buoyant and rises, measuring temperature and salinity on the way up. Some six hours later it reaches the surface and starts to transmit its data to satellites, which also fix the float’s position. Finally the bladder deflates and the float sinks to start all over again.
The cycle is repeated every 10 days, giving temperature and salinity profiles as well as information about current flow at 1000m depth. After 150-200 repeats (3-4 years) the batteries are exhausted. With no energy to bring it to the surface, the float drifts until the pressure case corrodes and leaks, and the float sinks to the sea floor.

Source: International Argo Project Office
Getting the data
Information from each float goes from the satellite to a receiving station and then to laboratories where the data are checked and converted into numbers representing temperature, salinity...
Within 24 hours the data are passed to places like the UK Met Office where it is used in climate forecasting.
Later scientists make detailed corrections to make sure the data are of the quality needed to measure the very small but important changes in temperature and salinity that might be due to climate change.
An example of Argo data
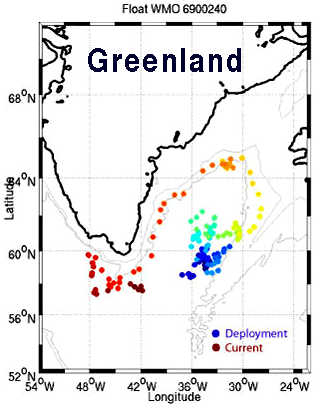
The sea south and east of Greenland is an area of important loss of heat from the ocean to the atmosphere in winter.
The map shows the path taken by an Argo float drifting in the waters off Greenland. Dots show where it drifted since June 2004. It started in the Irminger Sea (blue) and is moving into the Labrador Sea (red).
The plot below shows the temperature and salinity measurements made over time.

Source: LPO, IFREMER, France
