2. Wind Driven Surface Currents
Global Wind and Current Patterns
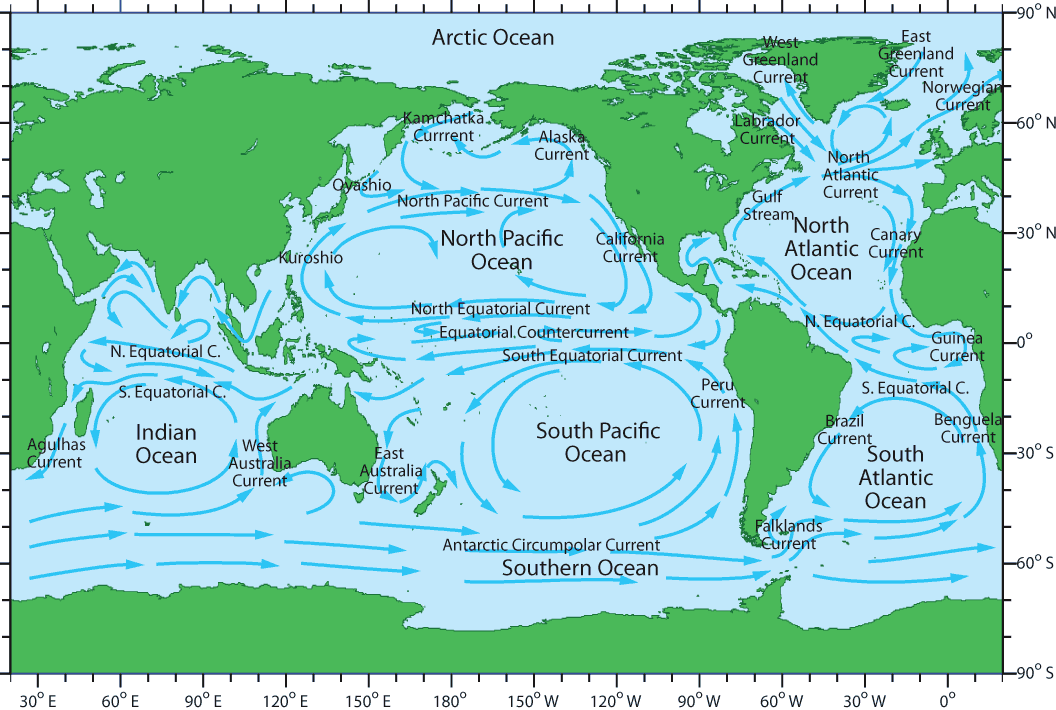
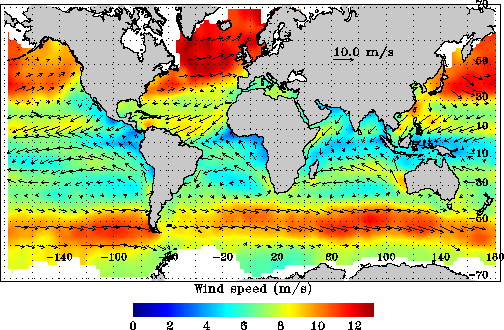
Prevailing winds and surface currents
As the winds sweep across the ocean surface, they drive the ocean surface currents. Over periods of months to years they set up a global circulation of surface currents, which reflects the patterns of the prevailing winds.
Look at the map of global currents compare it to the average winds on the right. Which currents are set up by the following prevailing winds?
- The northern hemisphere westerlies
- The northeast trade winds
- The southeast trade winds
- The 'Roaring Forties' (southern hemisphere westerlies)
Western boundary currents
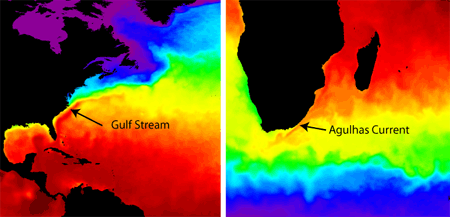
When the water in the Equatorial Currents reaches the western margins of the ocean basins, it piles up by as much as 15cm and spills northward or southward in strong, narrow currents. Examples of such warm, western warm are Gulf Stream in the North Atlantic, and the Agulhas Current in the Southern Indian Ocean.
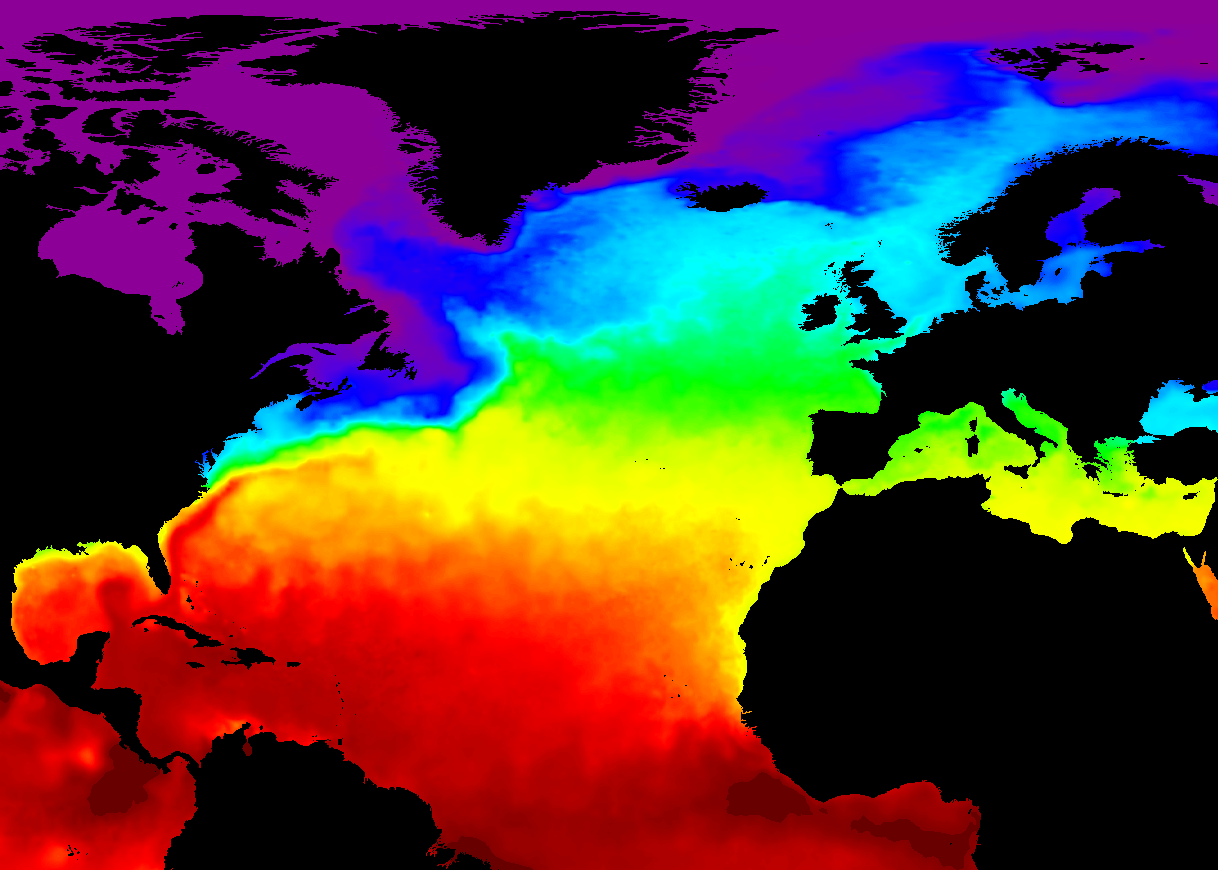
- Can you identify the Gulf Stream and the Agulhas Current in the sea surface temperature (SST) images below?
- There are three other western boundary currents. What are they called?
Back across the ocean
As the warm western boundary currents move away from the equator, the Coriolis force becomes stronger, turning the water back towards the east. At around 40 degrees latitude the current leaves the edge of the continents to flow eastwards across the open ocean, pushed by the prevailing westerlies. Along the way the water releases heat to the atmosphere and cools down.
All the way, the Coriolis force keeps turning the flow to the right in the northern hemisphere, and to the left in the southern hemisphere, until the cold water starts heading back towards the equator, completing the circle.
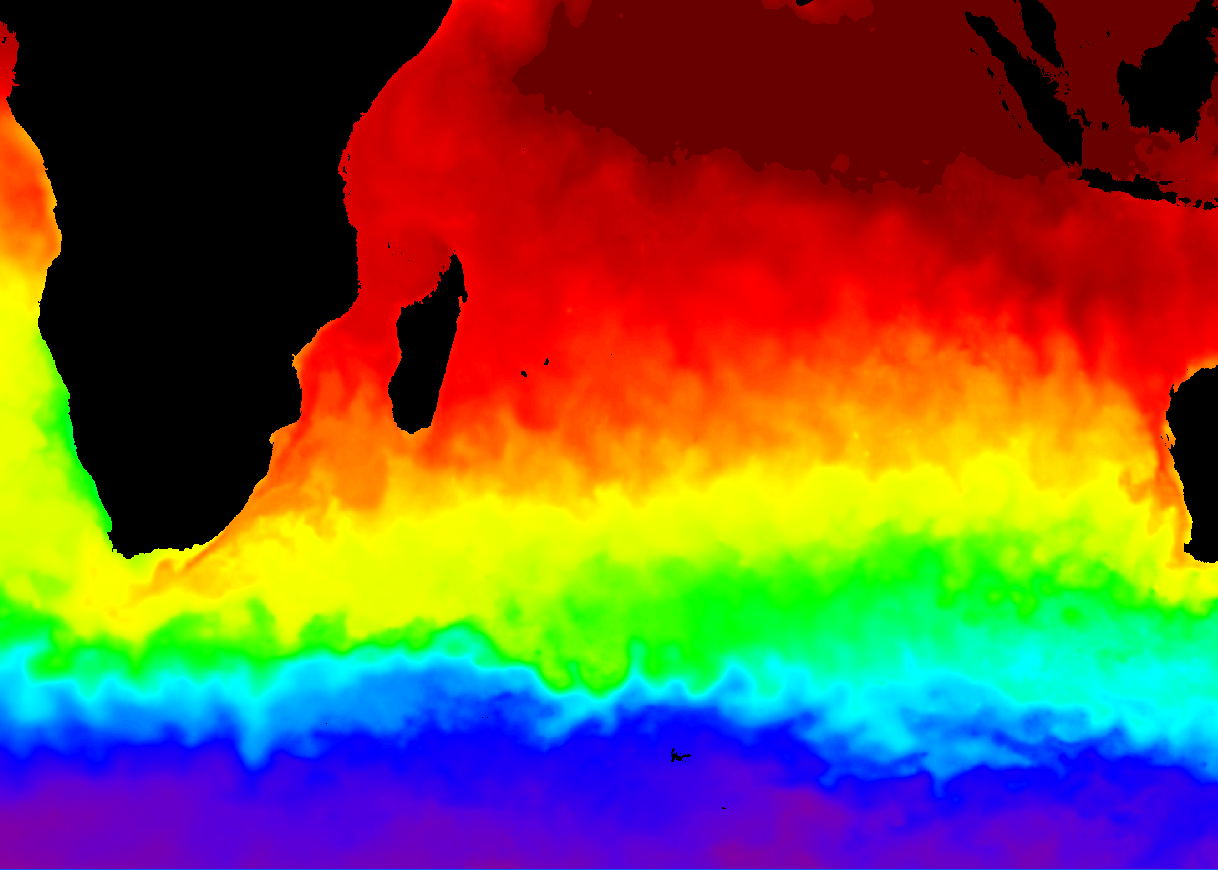
Global sea surface temperature
The path of the ocean currents can be seen on maps of sea surface temperature (SST) such as one below. You should be able to see warm currents flowing away from the equator on on the western side of the ocean basins, and cold water flowing towards the equator on the eastern side.
You may also notice how the Atlantic looks different from the Pacific in the northern hemisphere. What would you say is the main difference?
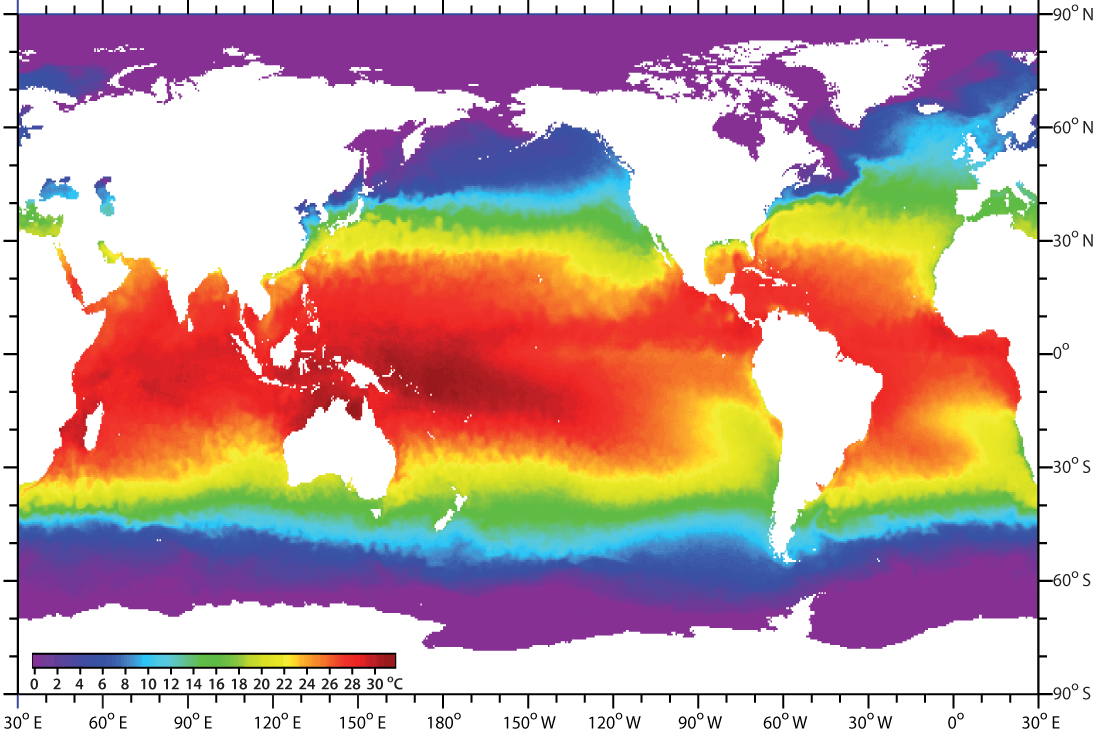
Eastern boundary currents
The cold currents that flow back to the equator along the eastern side of the ocean basis are known as - you guessed it - eastern boundary currents. Again there are five : The California Current, the Peru Current, the Canary Current, the Benguela Current, and the West Australia Current.
- Can you identify the five eastern boundary currents on the sea surface temperature map above?
- How do they appear compared to the western boundary currents?
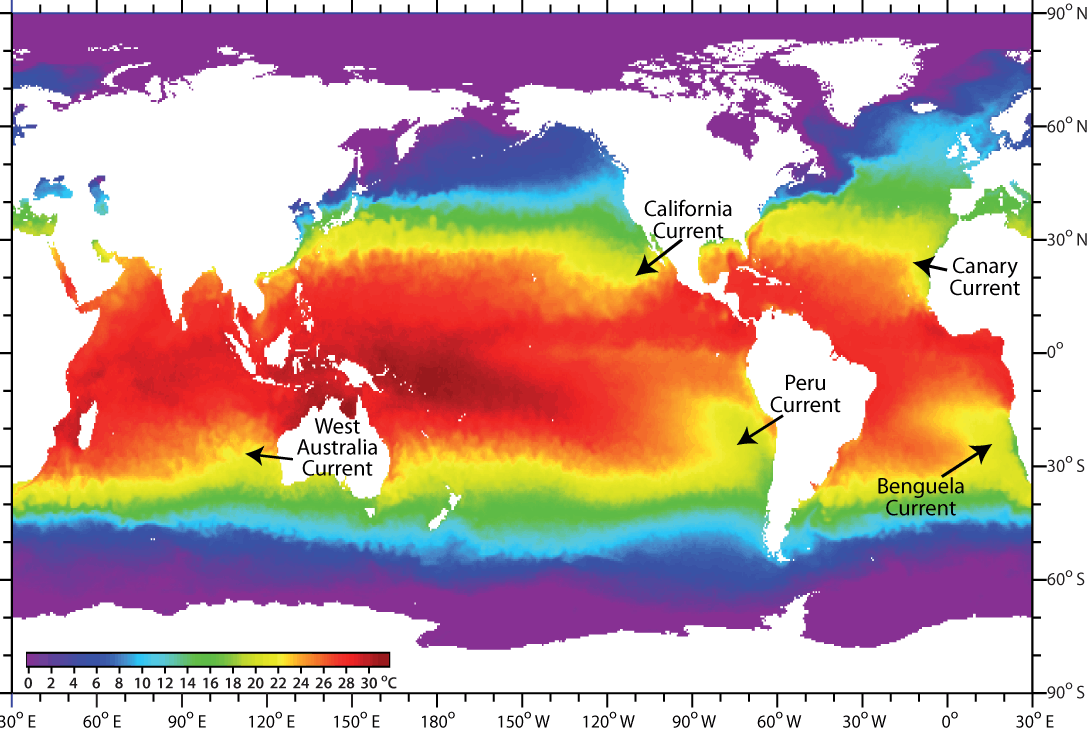
The eastern boundary currents flow more slowly than the vigorous currents on the western margin of the ocean basins. The Canary Current in the Atlantic and California Current in the Pacific rarely reach speeds of more than 1 km per hour
Subtropical ocean gyres
As you have seen, the ocean currents form large gyres (large circular flows) in each ocean basins. There are five in all: two in the Pacific - north and south of the equator, two in the Atlantic, and one in the Indian ocan, south of the equator. In the northern Indian Ocean the landmasses of Asia prevent the formation of a full gyre. Instead there is a seasonally reversible current, driven by the Monsoon winds.
