2. Ecosystems (6/6)
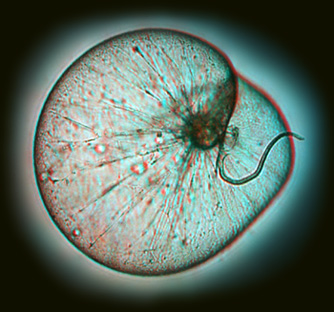
Noctiluca Scintillans
Although most algae are green, there are also species with a very distinct red-coloured. One of these is Noctiluca scintillans. This is relatively large (0.5 mm in diameter) dinoflagellate which get its food not by photosynthesis but by phagocytosis (engulfing other algae, bacteria and fish eggs).
Source: NOAA
N. scintillans is best known for its bioluminescence. When it perceives danger it gives over a phosphorescent pulse to frighten off its enemies. We can see this as sparkles in the water, the common name for this algae is also sea sparkle.
With satellites we can measure the concentration of these algae and other species. High concentrations of Noctiluca scintillans were perceived off the Belgian coast in 2003 (Van Mol et al., 2007).
Source: REVAMP
interpretation of the images
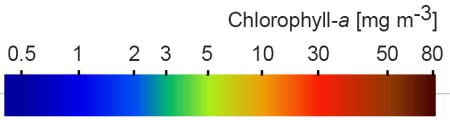
Before we have a better look at these images, it is first important to have a better look at the colour code (the legend) of the maps. The legend is provided here:
Source: REVAMP
Question: What is the highest concentration that is shown in this map?
Question: Near the coast values of 5 to 20 mg m-3 are considered to be too high for a healthy ecosystem and indicate the influence of high nutient concentrations. What is their colour?
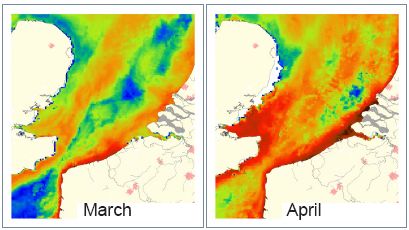
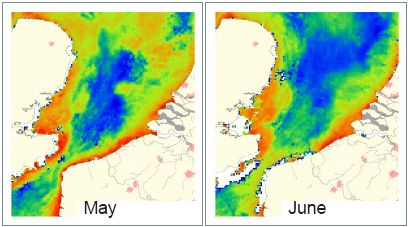
More maps of the Southern North Sea
With satellites we can observe the coastal zones many times in one year. With the MERIS instrument we could observe the Belgian and Dutch coast almost 80 times in 2003. When we combine these images for every month, we get the following maps for May and June:
Source: REVAMP
Do you know now when it happened ?
Question: Compare the maps from March to June 2003. When was the highest Chlorophyll-a concentration near the coast off Belgium and in the Voordelta near the Dutch province Zeeland?
