3. Interpretation of the Linear Regression Model (1/2)
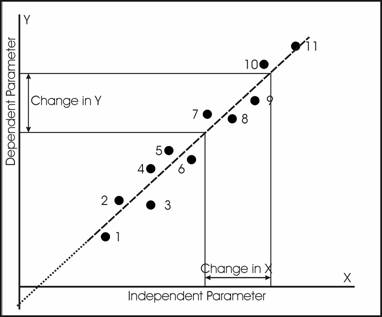
Open your spreadsheet from the previous lesson, or create one from text file and construct regression lines for each crop. What can we read from these regression lines? Firstly, the offset value b0 is the value of Y when X = 0, so it is the value of Y where the line intercepts the Y axis.
The second parameter, also called the gain, is the slope of the line, or the ratio of the Change in Y to the Change in X. This slope is positive when the line is sloped in the direction as shown in the Figure; if the line was sloped from lower right to upper left, then the slope would be negative.
We know that each observed value of X will have its comparable Y value, its estimated Y value from the regression line and the difference between these two is its residual. We know that the sums of squares of these residuals is minimised in this process.
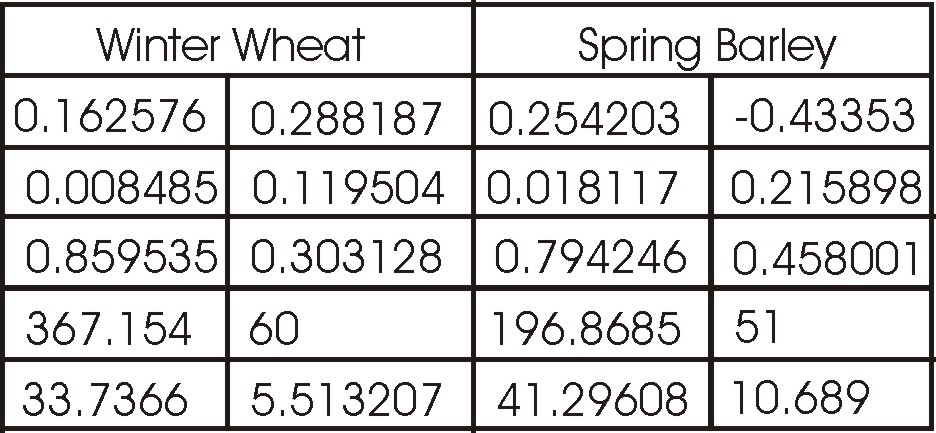
The results given in the Table and in your spreadsheet show that the Spring Barley has a negative intercept, whilst the Winter Wheat has a positive intercept. In addition, the slope of the Spring Barley line is steeper than the Winter Wheat Line.
Now we have derived the best curve fit to a line using the Least Squares criteria. However, it is also usually important to also find out what confidence that one can have in this result. For example, can we have similar confidence in both curve fits or is one significantly superior to the other?