2. Oil Pollution
Case Study: The Sea Empress Oil Spill
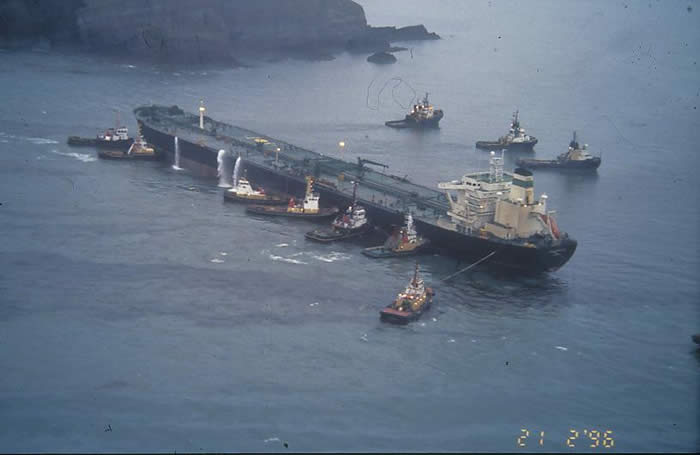
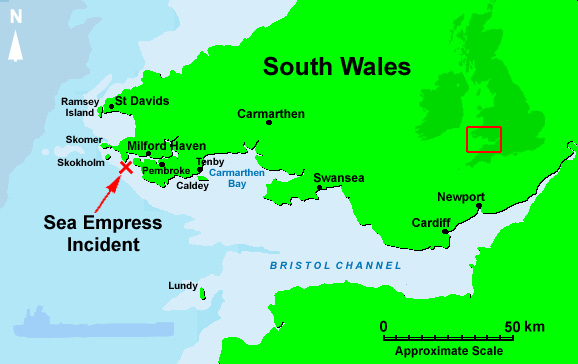
On 15th February 1996 the Sea Empress went aground at St. Anne's Head near the entrance to Milford Haven in Pembrokeshire in Wales. Over the next 7 days 72,000 tonnes of light crude oil from the Forties oil field in the North Sea leaked into the sea. The fuel tanks also sprang leak.
For several days strong winds prevented the Sea Empress from being re-floated. On February 21st the wind calmed, and the ship was towed into Milford Haven, where she continued to leak cargo and fuel oil until the tanks could be emptied. Much of this oil ended up on the mudflats to the south of the harbour, in an area of high environmental value.
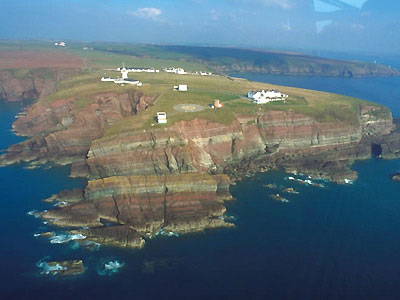
The Pembrokeshire coast is highly valued for its wildlife and outstanding natural beauty, and is popular with both tourists and locals. The time of year, the wind direction and effective clean-up at sea reduced the environmental impact, but there were never-the-less adverse effects on fisheries and tourism, as well as on wildlife. Overwintering birds feeding on the mudflats and at sea, were particularly badly affected.
Fate of the oil
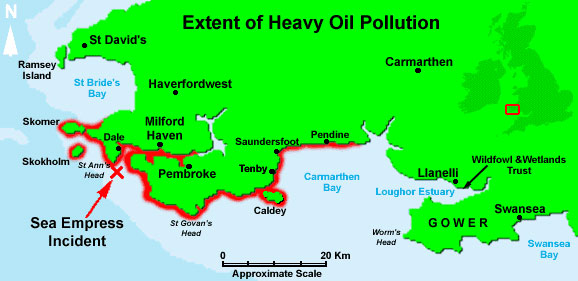
About 40% of the light oil evaporated and was carried away by the wind. A further 28% was dispersed naturally by waves and currents. Mechanical recovery was hampered by the strong winds and recovered only about 1-2% of the oil. However, dispersant spraying from aircraft was very successful and resulted in about 24% of the oil being chemically dispersed. The remaining 5-7% of the oil reached the shore, and spread over a 200 km long shoreline. By then the 4-5 thousand tonnes of oil had been transformed into about 11-16 thousand tonnes of water-in-oil emulsion.
Remote sensing of the oil spill
Airborne support for clean-up at sea
Aerial surveillance of the area used visible observations by trained personnel. These were supported by Sideways-Looking Airborne Radar (SLAR) and ultraviolet and thermal infrared video cameras. The video output was displayed on monitors in the aircraft cabin. In this way the survey aircraft was able to direct the clean-up effort to areas of thick oil, where mechanical recovery or dispersant spraying would be most effective.
Environmental impact assessment
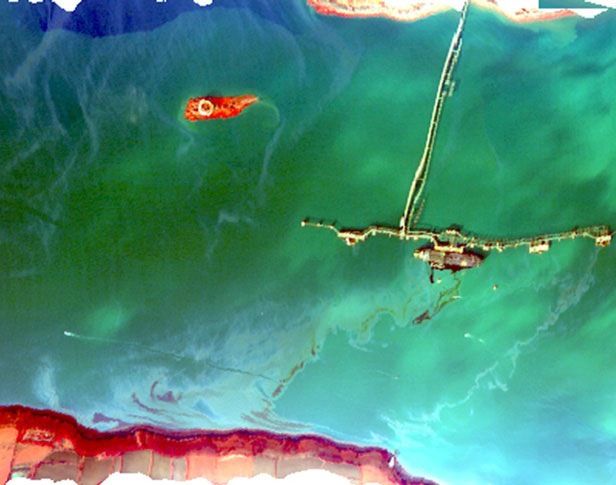
For two days (22 and 27 of February) additional surveys were carried out from a second aircraft belonging to Environment Agency, equipped with thermal video and CASI (Compact Airborne Spectrographic Imager) - an instrument that records light reflected from the sea at optical and near-infrared wavelengths.
The CASI data was not used to direct clean-up, but was later combined with data from the Coastguard's aircraft and satellite images from ERS and RADARSAT to assess the geographical extent of the oil spill and the severity of the pollution in affected areas. This impact assessment also made recommendation for how to improve the use of remote sensing techniques in future oil spills.
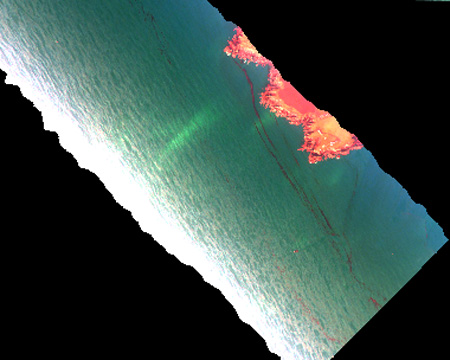
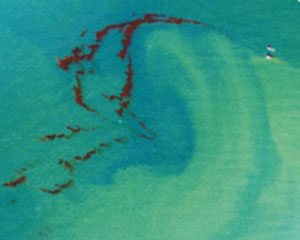
Satellite radar images (SAR)
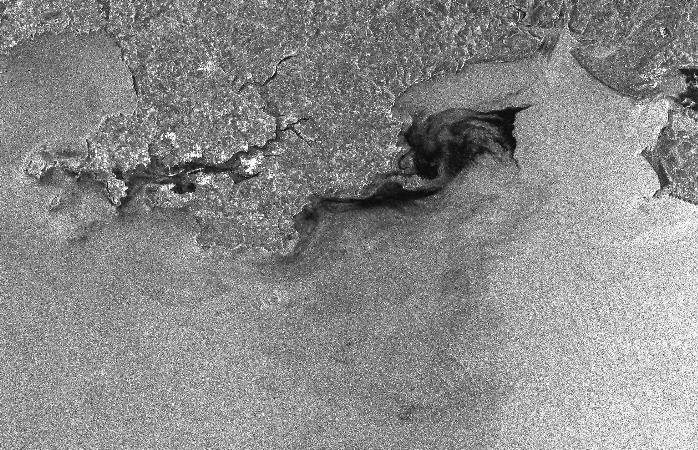
Satellite images were not used to support the clean-up. In 1996 satellite radar sensing of oil spills were still at the experimental research stage, and processing of the data took too long for the images to be of use to those planning the oil spill response.
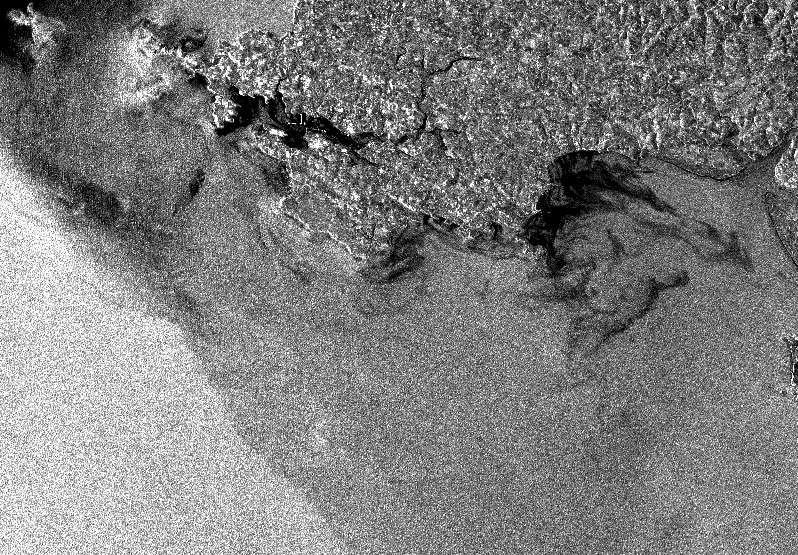
A small number of radar images from the European Space Agency's ERS satellite and the Canadian RADARSAT did show the surface oil. These were used for later studies of the spill. Two of these images are shown on the left.
Once the clean-up operation was over, the Environment Agency commissioned a study of all available remote sensing data to develop recommendations for how to use remote sensing effectively in future incidents. This study showed that the best information is obtained with data from different sensors, with satellite images giving an overview, and airborne data giving more immediate and detailed information.
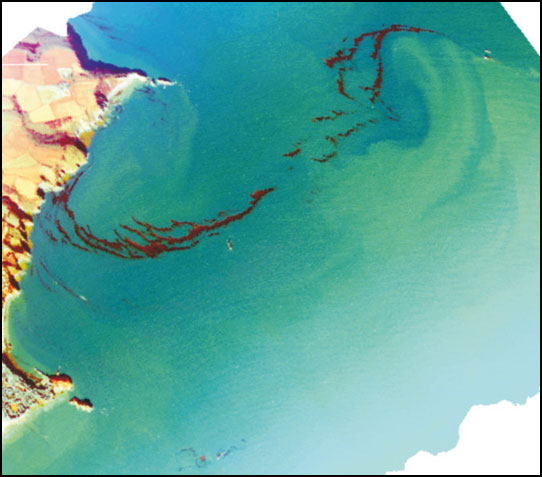

Comparing airborne sensors
Radar, ultraviolet, optical (visible and near infrared) and thermal sensors are sensitive to different thicknesses of surface oil.
Radar sensors are sensitive to very thin oil
Ultraviolet sensors are sensitive to oil thicker than 0.01-0.05 micron. Oil appears brighter than water, increasing in brightness with increasing oil thickness.
Optical sensors can measure relative oil thickness from about 2-500 micron, and can also detect oil dispersed
in the water.
Thermal infrared sensors measure relative thickness from about 50 micron.
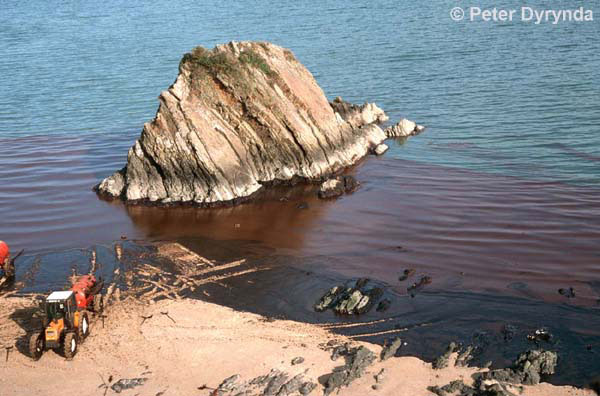
The images on the right show the same area of surface oil (near Tenby) measured with both optical and thermal infrared sensors. Current oil spill response in the UK now has access to all these different types of airborne sensors, which may be used not only in post-spill impact assessment, but also combined with oil spill models to help predict where the oil may be transported by wind and currents.
Oil spill response
The oil spill response was coordinated by the Marine Pollution Control Unit (MPCU) of the UK Coastguard. At sea a surveillance aircraft directed the clean-up effort to areas with thick oil, where dispersant spraying and recovery with booms and skimmers would be most effective.
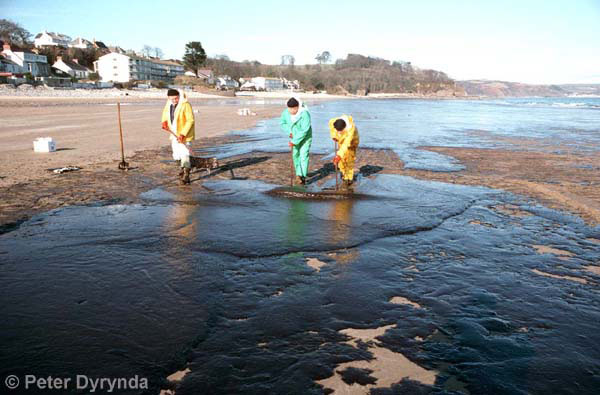
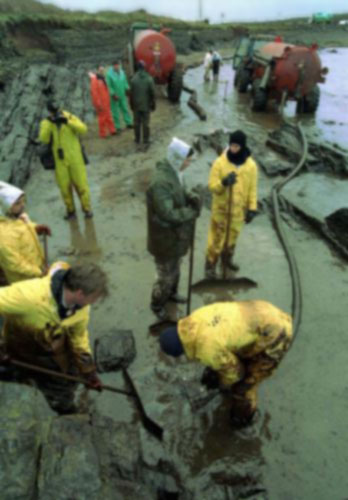
The shoreline clean-up involved over a thousand workers (not counting volunteers who were trying to save wildlife). The effort concentrated on removing oil from beauty spots and public beaches of importance to the tourist industry. Within six weeks of the accidents these beaches were visibly clean and available for use.
By Easter only about 500 tonnes of oil was left on rocks and beaches. Some clean-up was still required over the next 18 months, when pockets of oil appeared on beaches or were released from offshore sediments.
In general the oil spill response was considered successful, and the damage not as severe as it might have been. There were several reasons for this. The time of year meant tourism and birdlife was less affected than if the spill had happened later in the year. Strong winds drove the oil away from the coast during the first week, and created waves that helped to disperse the oil at sea. This meant there was time to mount an effective clean-up operation at sea, reducing the amount of surface oil that finally drifted ashore when the winds changed.
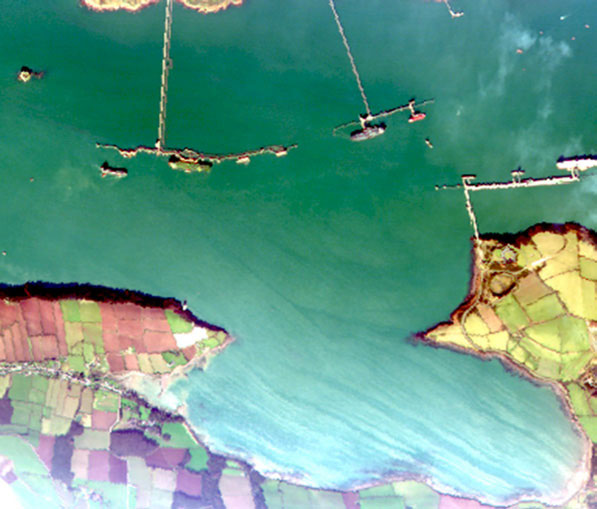
A look at two areas affected by the oil
Angle Bay, Milford Haven
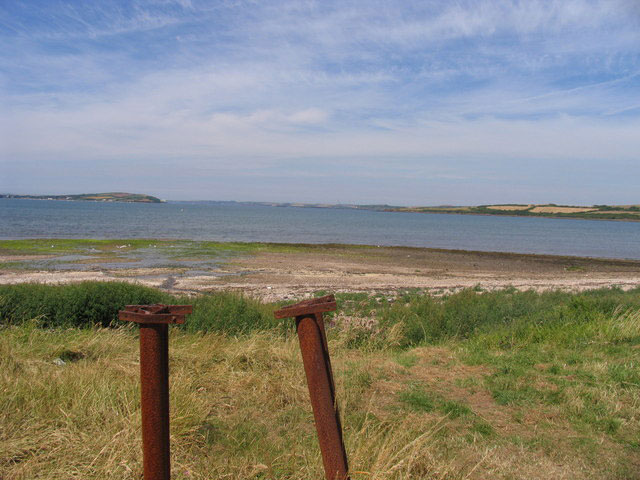
Angle Bay on the south side of Milford Haven was among the first beaches to be affected. Oil came ashore on the evening of the original grounding, and over the next few days much of the coastline within the Haven was oiled. When the Sea Empress was brought into the Haven on 22nd February, oil continued to leak from the cargo and fuel tanks until these could be emptied (see CASI image on the left).
Angle Bay is well protected from wind and waves, with a shoreline over 3km long. The beaches and intertidal mudflats are important as feeding and roosting area for wintering and migrant wildfowl and waders. The bay also supports beds of the nationally rare dwarf eelgrass (Zostera noltii), and has been declared a Site of Special Scientific Interest (SSSI).
In places the shoreline is accessible from the road or the Pembrokeshire coast path, and these areas are of high value for leisure and tourism. In the past a considerable amount of shellfish gathering and bait digging also took place in the bay.
Cleaning began on 16th February with up to 20 people and continued until 20 March. Bulk oil was removed by trenching and suction, rock surfaces were cleaned with high-pressure washing. When clean-up resumed in mid- May it was reported that oil had penetrated into muddy sediments and mobile fuel oil was present below a surface covering of stones, some of this oil still remained after cleaning was stopped in autumn 1996.
After the spill there were some criticism of the clean-up in Angle Bay. Mudflats are very sensitive to being trampled and disturbed by people walking or by vehicle traffic. The clean-up crews tried to avoid damaging the area, but some ecologists were of the opinion that the clean-up effort did more damage than the oil itself, and that the mud-flats should have been left to recover undisturbed.
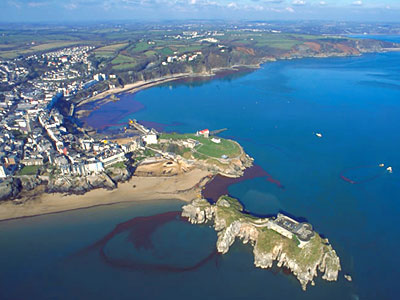
Saundersfoot Bay
Most of the oil that ended up on the beaches in West Carmarthen arrived on February 27 when the wind changed direction and brought large quantities of emulsion ashore in the Tenby area. Many of the beaches in this area are popular with tourists, particularly between the holiday resorts of Tenby and Saundersfoot Bay.

A major clean-up operation began, which involved over 650 people (not including those involved in wildlife rescue). The coastline in Carmarthen bay has a wide range of beach types: from popular sandy beaches to rock, coble and shingle beaches with cliffs. Many have difficult access and several are environmentally sensitive.
Most of the oil that reached the coast was water-in-oil emulsion. In the cold of winter it was viscous and stiff, and relatively easy to scrape off rocks and sandy beaches. This allowed the beaches to be cleaned of oil in time for the tourist season, and minimising impact on this industry.
Wildlife was more severely affected, especially birds. Hundreds of volunteers organised by the RSPCA helped to rescue seabirds, waders and other wildlife. Most of the oiled birds did not survive. Despite the loss, studies indicate that populations had largely recovered after a few years.
