3. المناخ وتغير المناخ
The greenhouse effect (4/4)
Is the Earth in a radiative equilibrium?
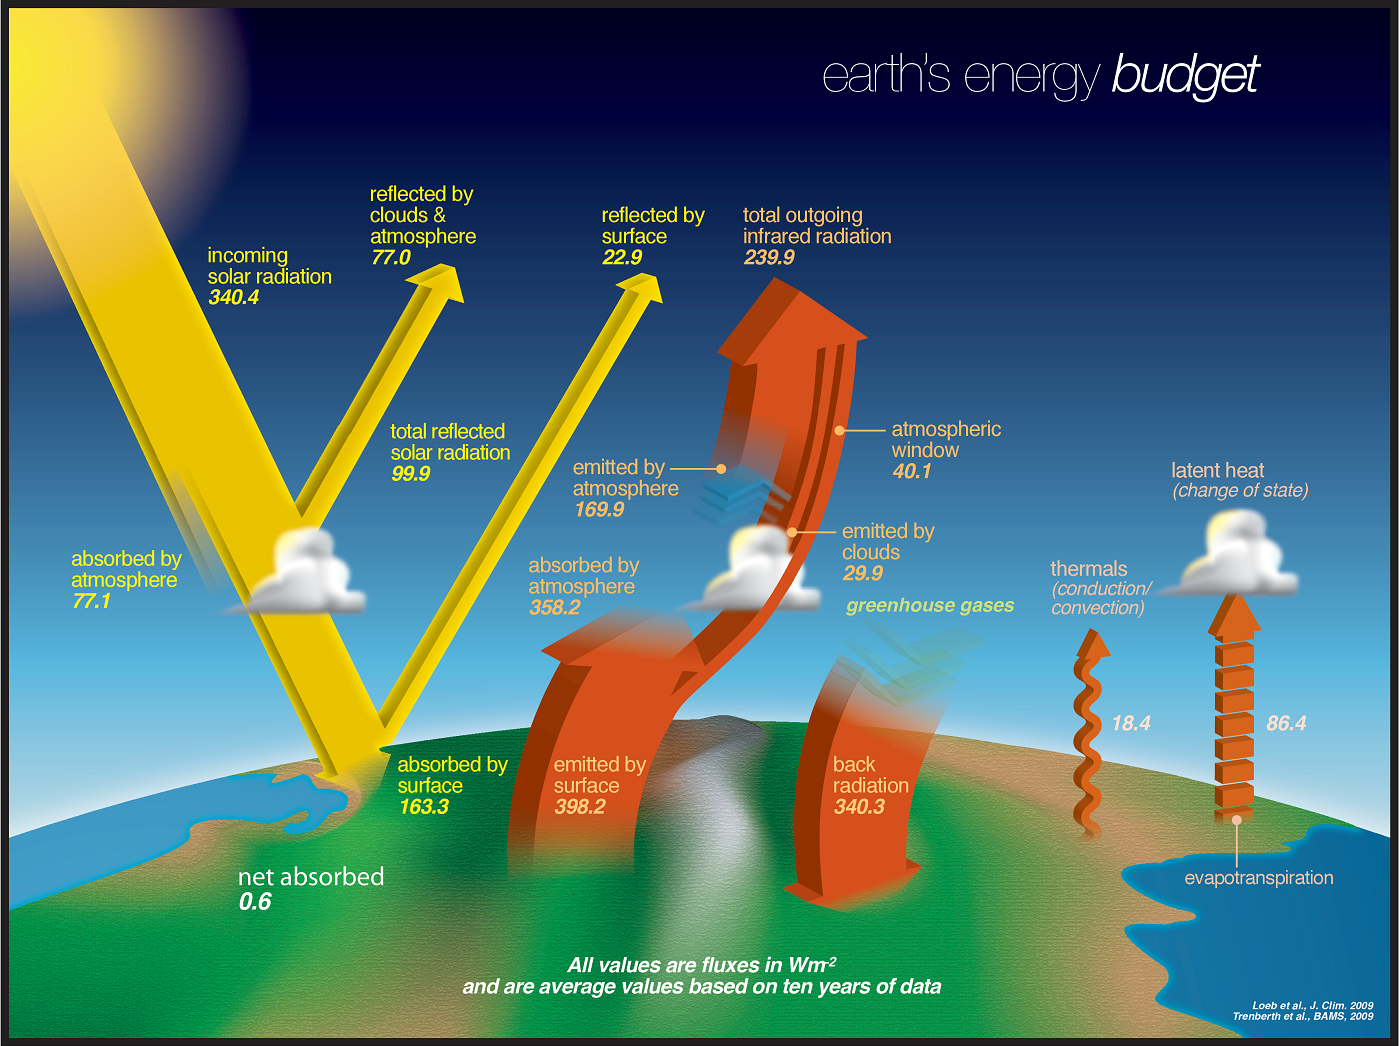
In the previous page we looked at the radiation transmission of a greenhouse. How does this look on the scale of the Earth? What other energy flows are important? NASA has compiled all this information on a poster shown below. The poster was published in 2014, using data from the previous ten years. On the website of the image sources you will find a link to download the poster, as well as links to the data sources.
The numerical values in the poster represent W/m² as annual averages. The solar radiation is shown with yellow arrows, the radiation in the infrared region is shown with red arrows.
In the poster, the greenhouse effect is made clear by the two "thickest" arrows of thermal radiation. The Earth's surface emits 398.2 W/m² of which 358.2 W/m² are absorbed by greenhouse gases in the atmosphere. 40.1 W/m², i.e., about 10% reach space through the infrared atmospheric window The warm greenhouse gases of the lower atmosphere reemit 340.3 W/m², this is the atmospheric back radiation; its value is as large as the total incident radiation from the Sun.
With the exception of solar irradiation, the numerical values given in the poster are only the approximations for the Earth as a whole; of course, they also vary from year to year. The decisive factor is the "net absorbed" excess of 0.6 W/m², the difference between the incoming solar radiation and the radiation leaving the Earth in the infrared and visible regions for the observation periods 2004-2014.

