Chapter 5. Remote sensing for coral reef mapping
Mapping the risks
Introduction
John is 17 years old. Last summer still evokes some nice memories. For the first time in his life, he went for three weeks on vacation with his parents. The destination was the city of Hurghada in Egypt. On the 5th of July, their plane landed at the airport near Hurghada. From that moment on, he kept a diary, just to keep the memories fresh.
Here you can read some passages from his diary.

Objectives
- Students can reproduce information that is given in a full text.
- Students can make a link between information in text and information on a map.
Materials
- Download the worksheet Mapping the risks (163 MB .rtf file).
- Internet access
Time needed
One class period
Procedure
Here you see a Landsat 7 ETM+ True Color Composite satellite image of the region around Hurghada.
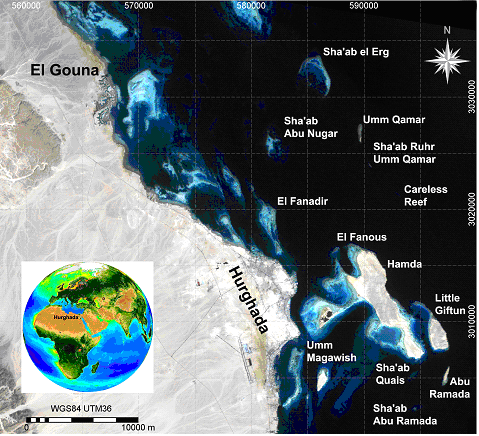
Source: Vanderstraeten, 2007.
- Can you point out on the image where John stayed with his family?
See image - Where can you find the oil-drilling platforms? Point them out.
See image - How are the colors in the interior on the image? Can you explain this?
The colors are very light, which means there is a lot of reflection, caused by the dry surroundings near Hurghada. - In the interior, you can see a typical pattern; can you explain what this is?
TIP: take the previous question in consideration!
These are dry river beds, called wadi. During short but heavy rainfalls fine materials, like sand, are transported through these channels. In dry periods, this fine sand causes the high reflection.
Combining the individual risk-assessment maps for each threat gives us the following overall risk assessment map for the Hurghada area.
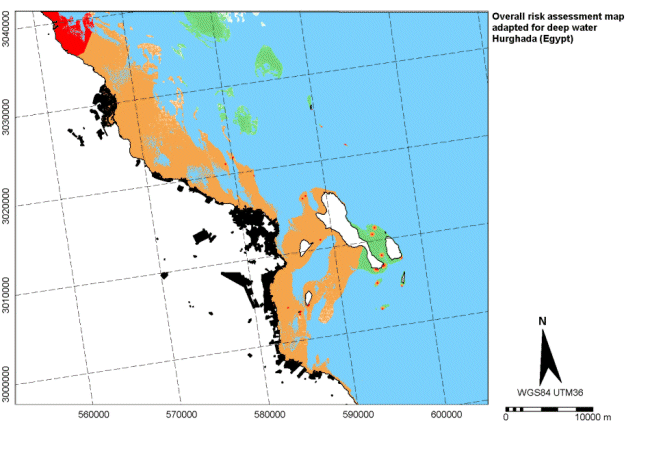
Source: Vanderstraeten, 2007.
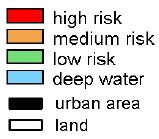
- Based on John's diary and the previous satellite image, can you complete the legend?
- Point out: El Gouna, Hurghada.
See image - In the Hurghada area, what is the main influencing factor causing a risk for corals?
The oil drilling platforms - Can you find four other factors in John's diary causing risks for the corals?
- snorkling and scuba-diving
- fisheries
- ports
- souvenir market
- In the risk zone along the coast, some areas don't seem to be at risk (color blue). Can you explain this?
If you take a look at the bathymetric map, the coastal zone is too deep for corals to grow. In these areas, there are no corals at risk.
