Chapter 4. Coral bleaching
Sea surface temperature and coral bleaching
Introduction
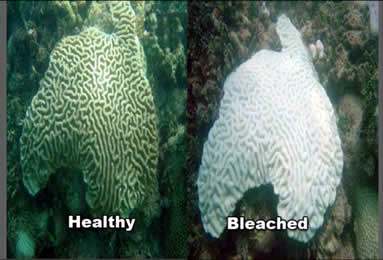
Coral reefs are fragile ecosystems. Scientists monitor ocean temperature since it is linked to coral bleaching episodes. Coral bleaching is caused by environmental stresses and results in corals ejecting zooxanthellae from their polyps.
Sometimes, small, localized bleaching events result from chemical spills, sedimentation, and decreases in ocean salinity from heavy rains or flooding. Mass bleaching appears to be caused primarily by an increase in water temperature and calm, sunny conditions. Even small temperature increases, as little as 1-degree Celsius above normal temperature range, over a period of a week or more, can cause corals to expel their zooxanthellae.
If conditions quickly return to normal, the coral may recover. Unfortunately in the face of other numerous threats, corals are often vulnerable and die from the bleaching process.
Objectives
Students gain experience reading satellite sea surface temperature data and derive whether coral bleaching occurs or not.
Materials
- Download the worksheet Sea Surface Temperature and coral bleaching (53 MB .rtf file)
- Internet access
Time needed
One class period
Procedure
- Divide the class into 4 different groups.
- The input of data (images) in this exercise can be changed easily.
The images are constantly updated on the website:
https://coralreefwatch.noaa.gov/main/.
TIP: Years in which a lot of bleaching occured are easiest for the students to interpret.
Answers
The main condition that is linked to coral bleaching is unusually high water temperature. Your assignment is to use satellite data to investigate whether this condition occurred in the Caribbean during early Fall 2005. You will be assigned to one of four locations:
- B: Bermuda, located at 32.0°N/64.5°W
- LSI: Lee Stocking Island (Bahamas), located at 23.5°N/76.5°W
- PR: West coast of Puerto Rico, located at 18.0°N/67.5°W
- USVI: US Virgin Islands, located at 18.0°N/65.0°W
A. What were the local conditions at your reef on September 2nd, 2005?
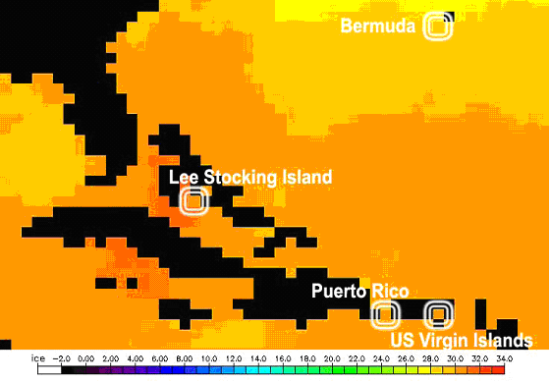
Find your reef on the Sea Surface Temperature figure. This map shows the temperature of the ocean waters, measured from some of NOAA’s satellites. The data are broken up into squares that are 50 km on a side.
1. What was the temperature at your reef on that day?
B:28°C; LSI: 30°C; PR: 29°C; USVI: 29°C
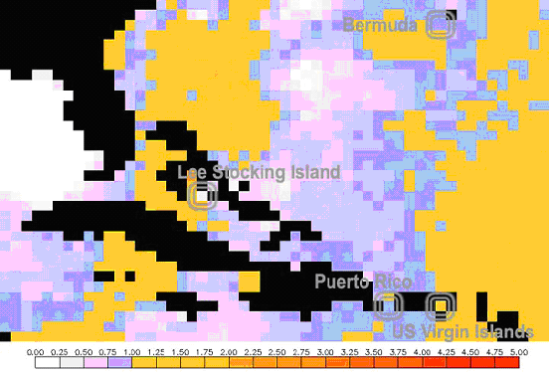
Now find your reef on the Coral Reef HotSpot figure. This map shows temperature anomalies. In this case, the anomaly is the temperature above the warmest monthly mean for each location. If your area is white, temperatures are less than the average for the warmest month. Warm colors indicate the number of degrees above the average for the warmest month.
2. Was your site unusually warm? If so, what was the anomaly?
B:+0.75°C; LSI: +0.25°C; PR: +0.75°C; USVI: +1°C
Sea Surface Temperature, September 2nd, 2005
Coral Reef Hotspot, September 2nd, 2005
B. How hot was the whole summer season?
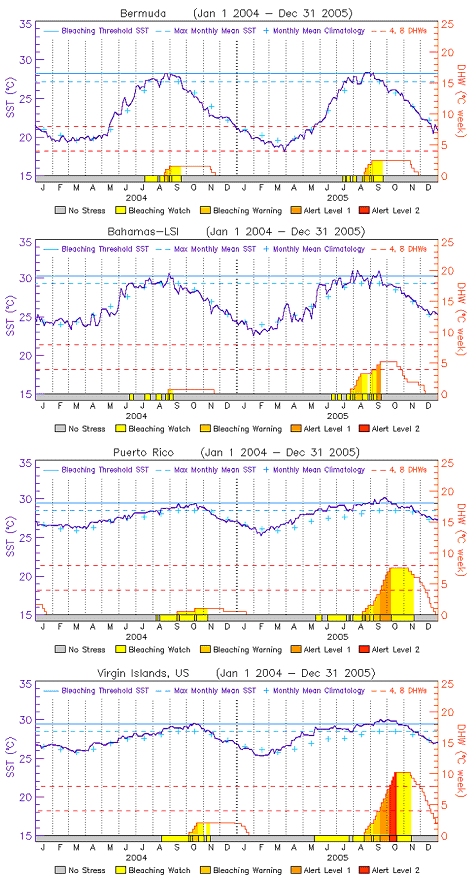
Find your reef in the Sea Surface Temperature (SST) Time Series figure. These graphs give the yearly temperature pattern for each of the four reef sites, measured by NOAA satellites. Note that both 2004 and 2005 are plotted on the same graph.
The SST for the site is shown in dark blue. The dashed light-blue line shows the average temperature for the warmest month. One degree above - that is the threshold temperature for coral bleaching, is shown as the solid light-blue line. When the temperature at the reef exceeds this threshold, the corals are thermally stressed.
3. Based on the 2005 temperature graph for your site, answer these questions:
- What was the highest temperature?
B:28.5°C; LSI: 31°C; PR: 30.5°C; USVI: 30°C - How long did the temperature stay at or above the bleaching threshold?
B:about a month; LSI: 1 month, then a decrease, than another month; PR: 2 months; USVI: 3½ months
The solid red line at the bottom of the graph shows the Degree Heating Weeks (DHW) for that site throughout the year. The DHWs show the accumulation of thermal stress the corals have seen in the last 3 months – how hot the water has been for how long. This is a good measure of how stressed the corals are.
4. How high did the DHWs get?
B:3 DHW; LSI: 6 DHW; PR: 8DHW; USVI: 11DHW
The dashed red lines show two DHW bleaching thresholds. When the value gets above 4, we expect to see significant coral bleaching. Values above 8 indicate that we expect severe coral bleaching, and some coral mortality as a result.
5. Do you expect that there was coral bleaching at your reef site in 2005? How severe?
B:mild, if any; LSI: moderate; PR: severe; USVI: very severe
Sea Surface Temperature Time Series
C. How stressed was your reef site compared to other reefs in the Caribbean region?
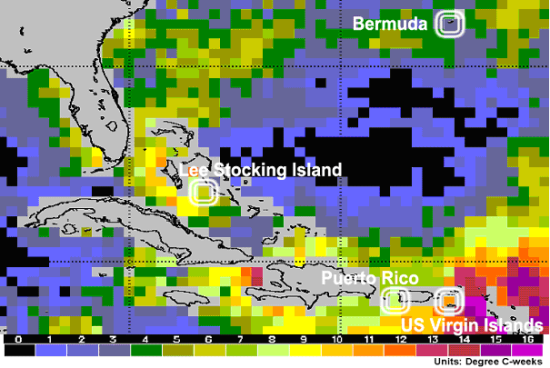
Find your reef on the Maximum Degree Heating Weeks (DHW) figure. DHWs measure the accumulated thermal stress on the reef. The figure shows the maximum DHW values experienced during 2005.
6. How did the thermal stress at your site compare to the stress experienced by the other three reefs highlighted in this exercise?
B<LSI<PR<USVI< or B<LSI=PR<USVI
7. How severe was the bleaching at your site compared to the other three reefs?
B<LSI<PR<USVI< or B<LSI=PR<USVI
Maximum Degree Heating Weeks, 2005