4. Precision Agriculture
Source: Integrated Crop Management newsletter, Iowa State University
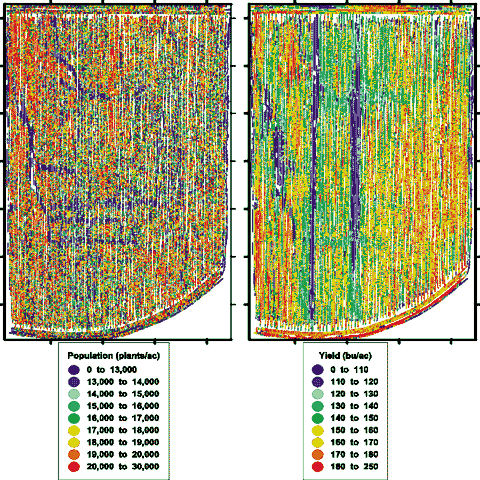
Estimating plant population and future yield
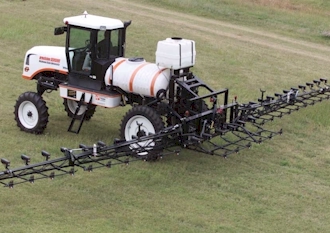
By measuring the reflectance of the plants at various wavelengths, it is possible to collect a lot of information about the status of the plants. In the above example, you can see the visual representation of the field, as seen by sensors onboard the tractor. From these data we can derive vegetation indices that help us estimate the vegetation cover and the Leaf Area Index (LAI). As the population of plants increases, the amount of biomass causes an increase in the overall near-infrared reflectance and a reduction in the red reflectance. From previous research, there are known relationships between the indices using those two regions of the spectrum and the amount of vegetation, a measure of which is the Leaf Area Index. From these estimates we can derive the population of the plants.
The data provided by the sensors can also be used to make an estimate on the future crop yield. By calculating the Normalised Difference Vegetation Index (NDVI), or the Soil-Adjusted Vegetation Index (SAVI) when vegetation cover is low, we can get information on the crops' vigour. A lot of research has been done to derive relationships between a vegetation index of a crop, measured at a particular time, and the final crop yield. These relationships can be used to help estimate the final crop yield, using the data collected by the sensors on-board the tractors. Each of these relationships, however, is usually only applicable for a particular crop, grown at a specific region and the remotely sensed data need to have been collected at a particular moment during the growth period.
Source: Oklahoma State University
Question: Look at the two classification images. Can you explain why there are two vertical lines in the crop yield classification that show very low yield (blue colour)?
