Welcome to the Tutorial ‘3D Models’
Why do we find three-dimensional images more attractive?
At a glance, which representation of information do you find easiest to interpret? (Note: each time both materials depict the same information)
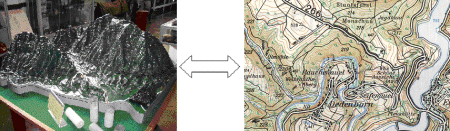
A scale model or a topographical map?
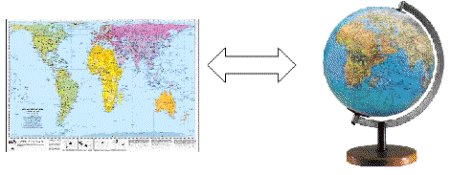
The globe or a world map?
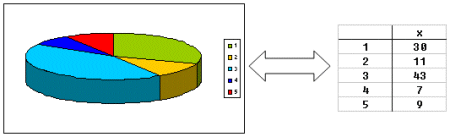
A circle graph or a chart?
Younger children will automatically choose the scale model, the globe and the circle graph. As you grow older, it becomes easier to interpret the other representations.
In the case of the scale model and the globe, the geographical information is represented as in reality - in three dimensions but in a much smaller scale. These representations are very intuitive.
The shape of a landscape can also be represented on a two-dimensional map by using a variety of techniques, for example, by means of contour lines or relief shading. However, you will need some spatial insight to understand the information available on such a map correctly. It is not straightforward to mentally re-create the three dimensional picture out of a two-dimensional map or chart.
To be able to interpret a 3D-scene on a 2D-image, our brains need some exercise!
Luckily, the current technological evolution has triggered new techniques or means of representation which can display the entire information and which can be easily understood. One of these representation tools is the 3D representation.
In this tutorial we would like you to think about ...
- the meaning of 3D
- the basic principles that make it possible to see 3D
- how maps are created from satellite images
- what happens when you are wearing those two-coloured glasses in a 3D-movie
- some 3D applications in Google Earth
