1. Soil Degradation
Monitoring the progress of desertification
In order to monitor the development and advancement of desertification or erosion in general, historical data are required. Satellite remote sensing data have been collected since the late 60s and the archives form an invaluable source of information regarding the status of soil quality in the past.
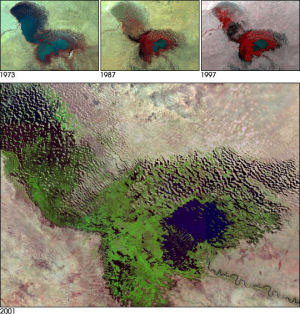
The image above protrays the reduction in size of the Lake Chad in Africa, over a span of 28 years. Increased demand for water, both for irrigation of agricultural fields and for human consumption, has taken its toll on the size of the great lake, along with increased temperatures due to climate change. Where the lake once stood, there is now vegetation, as it can be seen by the top three false colour images. The bottom image is a composite of LANDSAT-7 images, showing the the land cover change from water to vegetation (in green) and the area currently covered by water (in blue). The top left section of the lake, which was the first to dry out, was replaced initially by vegetation, but eventually, this vegetation became sparse, revealing the sandy soil underneath.
These historical data allow us to note trends in the loss of water availability and through this information, we can plan and act accodringly.
Question: The fact that the lake is shrinking, means that the water input is less than the output. Can you identify what those are,
and why they have changed in the last 30 years?

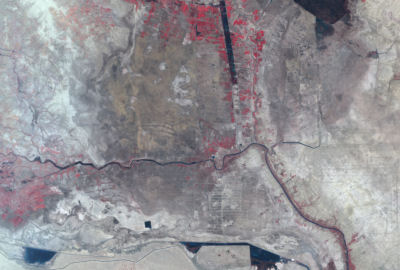
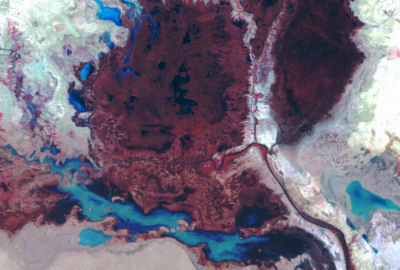
The false-colour images on the left show the Mesopotamian region in the Middle East and were captured by two LANDSAT satellites. The top was captured in 1973 by LANDSAT MSS and the bottom one by LANDSAT-7 ETM+. The red colour represents the near-infrared reflectance, which suggests the presence of vegetation. The dark red colour in the 1973 image, represents wild vegetation growing in the marsh, while the light red colour in the 2000 image, are agricultural crops, irrigated by the rivers.
The creation of dams in the Tigris and Euphrates rivers, have reduced the water input in the areas shown. As a result the wetlands have all but disappeared and many plant and animal species in the area, now face extinction. Where the wetlands once where, there is only dry barren ground now, with the occasional salt flats, where lakes and rivereds used to be. The area has been converted to a desert and the small area still covered by vegetation on the top right corner of the images is still under threat.
This is a very descriptive example of monitoring the loss of vegetation cover, through a period of time. This extraordinary change has happened over a course of 30 years, but signs of the trend were visible from the 1980s and 1990s. Increased temperatures due to climate change have played a role in the desertification process, but the human factor was the catalyst, through the disruption of water flow in the two major rivers.


